Osage vs British West Indian Vision Disability
COMPARE
Osage
British West Indian
Vision Disability
Vision Disability Comparison
Osage
British West Indians
2.7%
VISION DISABILITY
0.0/ 100
METRIC RATING
315th/ 347
METRIC RANK
2.4%
VISION DISABILITY
0.2/ 100
METRIC RATING
258th/ 347
METRIC RANK
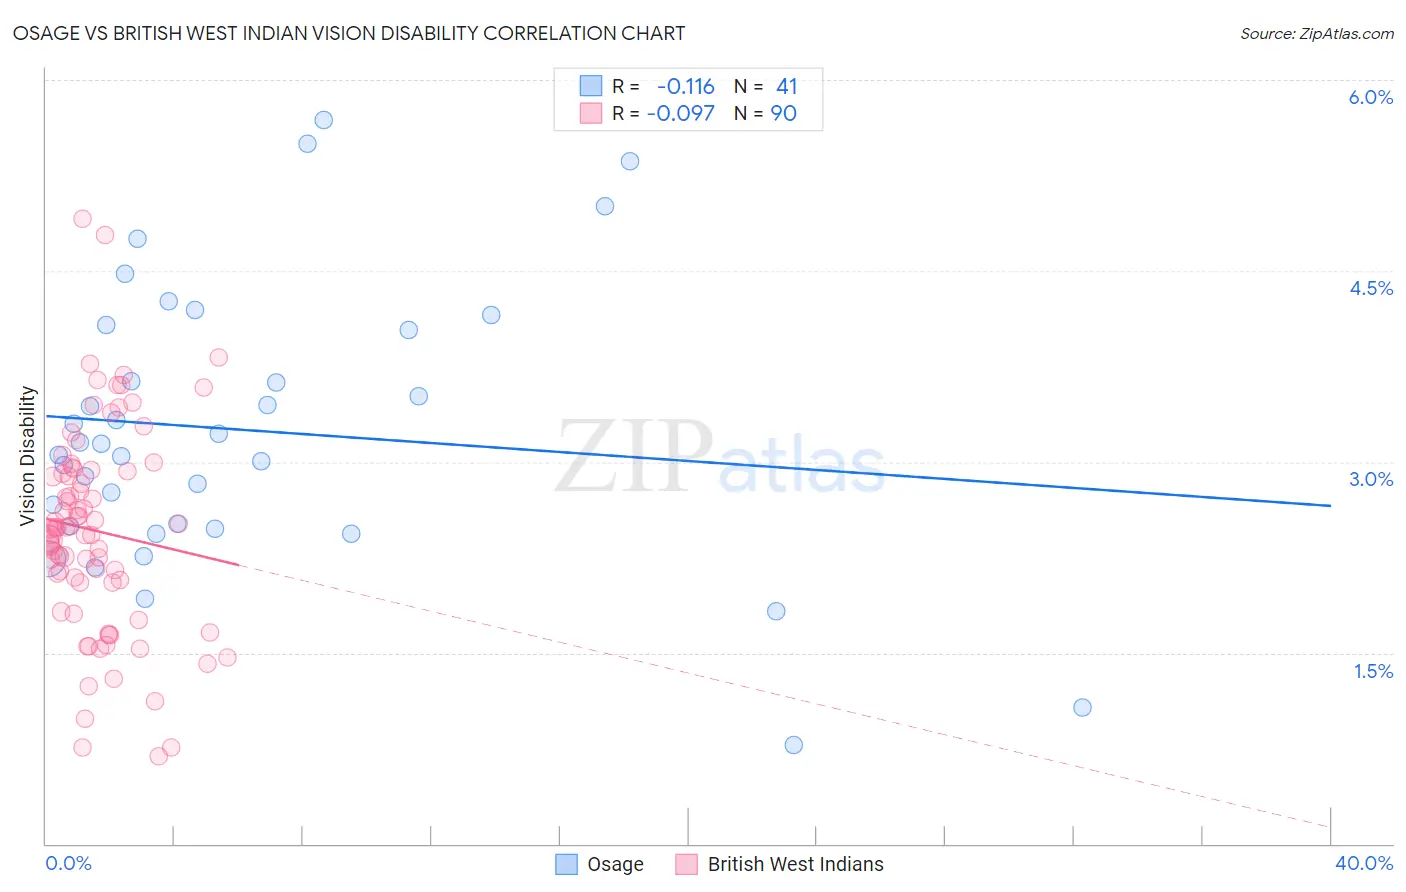
Osage vs British West Indian Vision Disability Correlation Chart
The statistical analysis conducted on geographies consisting of 91,791,636 people shows a poor negative correlation between the proportion of Osage and percentage of population with vision disability in the United States with a correlation coefficient (R) of -0.116 and weighted average of 2.7%. Similarly, the statistical analysis conducted on geographies consisting of 152,656,030 people shows a slight negative correlation between the proportion of British West Indians and percentage of population with vision disability in the United States with a correlation coefficient (R) of -0.097 and weighted average of 2.4%, a difference of 12.8%.
Vision Disability Correlation Summary
| Measurement | Osage | British West Indian |
| Minimum | 0.78% | 0.69% |
| Maximum | 5.7% | 4.9% |
| Range | 4.9% | 4.2% |
| Mean | 3.2% | 2.5% |
| Median | 3.1% | 2.5% |
| Interquartile 25% (IQ1) | 2.5% | 2.1% |
| Interquartile 75% (IQ3) | 4.1% | 2.9% |
| Interquartile Range (IQR) | 1.6% | 0.88% |
| Standard Deviation (Sample) | 1.1% | 0.81% |
| Standard Deviation (Population) | 1.1% | 0.80% |
Similar Demographics by Vision Disability
Demographics Similar to Osage by Vision Disability
In terms of vision disability, the demographic groups most similar to Osage are Shoshone (2.7%, a difference of 0.43%), Yup'ik (2.7%, a difference of 0.63%), Inupiat (2.7%, a difference of 1.2%), Potawatomi (2.6%, a difference of 1.3%), and American (2.6%, a difference of 1.3%).
| Demographics | Rating | Rank | Vision Disability |
| Arapaho | 0.0 /100 | #308 | Tragic 2.6% |
| Immigrants | Yemen | 0.0 /100 | #309 | Tragic 2.6% |
| Blackfeet | 0.0 /100 | #310 | Tragic 2.6% |
| Dominicans | 0.0 /100 | #311 | Tragic 2.6% |
| Americans | 0.0 /100 | #312 | Tragic 2.6% |
| Potawatomi | 0.0 /100 | #313 | Tragic 2.6% |
| Inupiat | 0.0 /100 | #314 | Tragic 2.7% |
| Osage | 0.0 /100 | #315 | Tragic 2.7% |
| Shoshone | 0.0 /100 | #316 | Tragic 2.7% |
| Yup'ik | 0.0 /100 | #317 | Tragic 2.7% |
| Alaska Natives | 0.0 /100 | #318 | Tragic 2.7% |
| Tohono O'odham | 0.0 /100 | #319 | Tragic 2.8% |
| Blacks/African Americans | 0.0 /100 | #320 | Tragic 2.8% |
| Comanche | 0.0 /100 | #321 | Tragic 2.8% |
| Paiute | 0.0 /100 | #322 | Tragic 2.9% |
Demographics Similar to British West Indians by Vision Disability
In terms of vision disability, the demographic groups most similar to British West Indians are White/Caucasian (2.4%, a difference of 0.010%), West Indian (2.4%, a difference of 0.030%), Immigrants from Haiti (2.4%, a difference of 0.10%), Belizean (2.4%, a difference of 0.18%), and Fijian (2.4%, a difference of 0.40%).
| Demographics | Rating | Rank | Vision Disability |
| Immigrants | Laos | 0.4 /100 | #251 | Tragic 2.4% |
| Immigrants | Micronesia | 0.3 /100 | #252 | Tragic 2.4% |
| Japanese | 0.3 /100 | #253 | Tragic 2.4% |
| Haitians | 0.3 /100 | #254 | Tragic 2.4% |
| Immigrants | Guatemala | 0.3 /100 | #255 | Tragic 2.4% |
| Immigrants | Haiti | 0.2 /100 | #256 | Tragic 2.4% |
| West Indians | 0.2 /100 | #257 | Tragic 2.4% |
| British West Indians | 0.2 /100 | #258 | Tragic 2.4% |
| Whites/Caucasians | 0.2 /100 | #259 | Tragic 2.4% |
| Belizeans | 0.2 /100 | #260 | Tragic 2.4% |
| Fijians | 0.1 /100 | #261 | Tragic 2.4% |
| Jamaicans | 0.1 /100 | #262 | Tragic 2.4% |
| Immigrants | Belize | 0.1 /100 | #263 | Tragic 2.4% |
| Immigrants | Liberia | 0.1 /100 | #264 | Tragic 2.4% |
| Immigrants | Jamaica | 0.1 /100 | #265 | Tragic 2.4% |