Osage vs Swiss Vision Disability
COMPARE
Osage
Swiss
Vision Disability
Vision Disability Comparison
Osage
Swiss
2.7%
VISION DISABILITY
0.0/ 100
METRIC RATING
315th/ 347
METRIC RANK
2.2%
VISION DISABILITY
55.7/ 100
METRIC RATING
170th/ 347
METRIC RANK
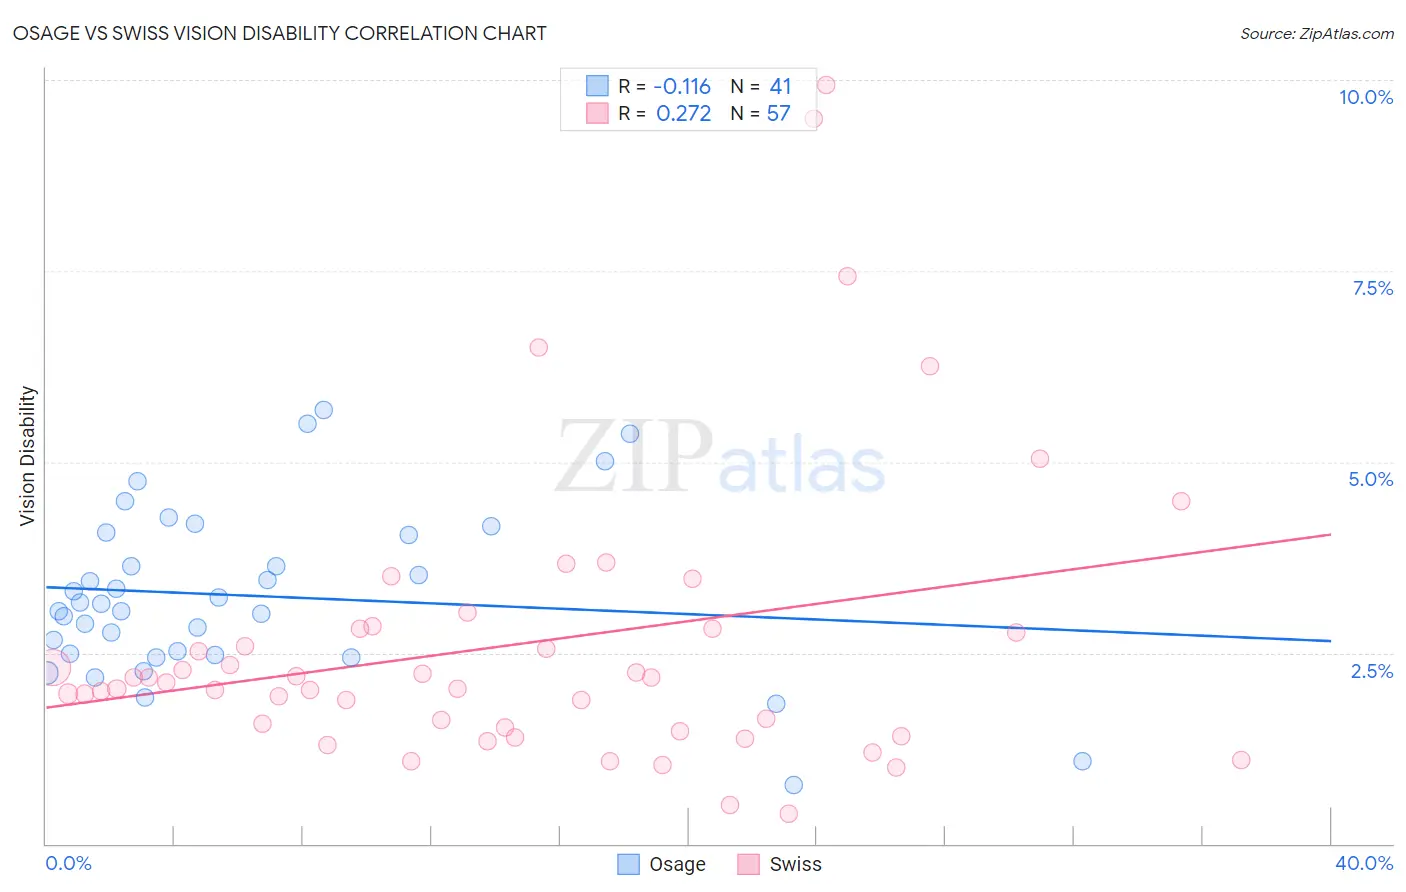
Osage vs Swiss Vision Disability Correlation Chart
The statistical analysis conducted on geographies consisting of 91,791,636 people shows a poor negative correlation between the proportion of Osage and percentage of population with vision disability in the United States with a correlation coefficient (R) of -0.116 and weighted average of 2.7%. Similarly, the statistical analysis conducted on geographies consisting of 464,374,244 people shows a weak positive correlation between the proportion of Swiss and percentage of population with vision disability in the United States with a correlation coefficient (R) of 0.272 and weighted average of 2.2%, a difference of 24.2%.
Vision Disability Correlation Summary
| Measurement | Osage | Swiss |
| Minimum | 0.78% | 0.39% |
| Maximum | 5.7% | 9.9% |
| Range | 4.9% | 9.6% |
| Mean | 3.2% | 2.6% |
| Median | 3.1% | 2.1% |
| Interquartile 25% (IQ1) | 2.5% | 1.5% |
| Interquartile 75% (IQ3) | 4.1% | 2.8% |
| Interquartile Range (IQR) | 1.6% | 1.3% |
| Standard Deviation (Sample) | 1.1% | 1.9% |
| Standard Deviation (Population) | 1.1% | 1.9% |
Similar Demographics by Vision Disability
Demographics Similar to Osage by Vision Disability
In terms of vision disability, the demographic groups most similar to Osage are Shoshone (2.7%, a difference of 0.43%), Yup'ik (2.7%, a difference of 0.63%), Inupiat (2.7%, a difference of 1.2%), Potawatomi (2.6%, a difference of 1.3%), and American (2.6%, a difference of 1.3%).
| Demographics | Rating | Rank | Vision Disability |
| Arapaho | 0.0 /100 | #308 | Tragic 2.6% |
| Immigrants | Yemen | 0.0 /100 | #309 | Tragic 2.6% |
| Blackfeet | 0.0 /100 | #310 | Tragic 2.6% |
| Dominicans | 0.0 /100 | #311 | Tragic 2.6% |
| Americans | 0.0 /100 | #312 | Tragic 2.6% |
| Potawatomi | 0.0 /100 | #313 | Tragic 2.6% |
| Inupiat | 0.0 /100 | #314 | Tragic 2.7% |
| Osage | 0.0 /100 | #315 | Tragic 2.7% |
| Shoshone | 0.0 /100 | #316 | Tragic 2.7% |
| Yup'ik | 0.0 /100 | #317 | Tragic 2.7% |
| Alaska Natives | 0.0 /100 | #318 | Tragic 2.7% |
| Tohono O'odham | 0.0 /100 | #319 | Tragic 2.8% |
| Blacks/African Americans | 0.0 /100 | #320 | Tragic 2.8% |
| Comanche | 0.0 /100 | #321 | Tragic 2.8% |
| Paiute | 0.0 /100 | #322 | Tragic 2.9% |
Demographics Similar to Swiss by Vision Disability
In terms of vision disability, the demographic groups most similar to Swiss are Lebanese (2.2%, a difference of 0.090%), South American Indian (2.2%, a difference of 0.11%), Northern European (2.2%, a difference of 0.36%), Scandinavian (2.2%, a difference of 0.36%), and Immigrants from Canada (2.2%, a difference of 0.36%).
| Demographics | Rating | Rank | Vision Disability |
| Icelanders | 66.1 /100 | #163 | Good 2.1% |
| Immigrants | Bangladesh | 65.5 /100 | #164 | Good 2.1% |
| Immigrants | Iraq | 64.8 /100 | #165 | Good 2.1% |
| Immigrants | England | 62.8 /100 | #166 | Good 2.1% |
| Immigrants | Africa | 62.6 /100 | #167 | Good 2.1% |
| Brazilians | 62.2 /100 | #168 | Good 2.1% |
| South American Indians | 57.4 /100 | #169 | Average 2.2% |
| Swiss | 55.7 /100 | #170 | Average 2.2% |
| Lebanese | 54.3 /100 | #171 | Average 2.2% |
| Northern Europeans | 50.1 /100 | #172 | Average 2.2% |
| Scandinavians | 50.0 /100 | #173 | Average 2.2% |
| Immigrants | Canada | 50.0 /100 | #174 | Average 2.2% |
| Immigrants | Fiji | 47.6 /100 | #175 | Average 2.2% |
| Yugoslavians | 46.5 /100 | #176 | Average 2.2% |
| Slavs | 46.0 /100 | #177 | Average 2.2% |