Okinawan vs Swiss Cognitive Disability
COMPARE
Okinawan
Swiss
Cognitive Disability
Cognitive Disability Comparison
Okinawans
Swiss
17.6%
COGNITIVE DISABILITY
6.8/ 100
METRIC RATING
216th/ 347
METRIC RANK
16.7%
COGNITIVE DISABILITY
99.2/ 100
METRIC RATING
82nd/ 347
METRIC RANK
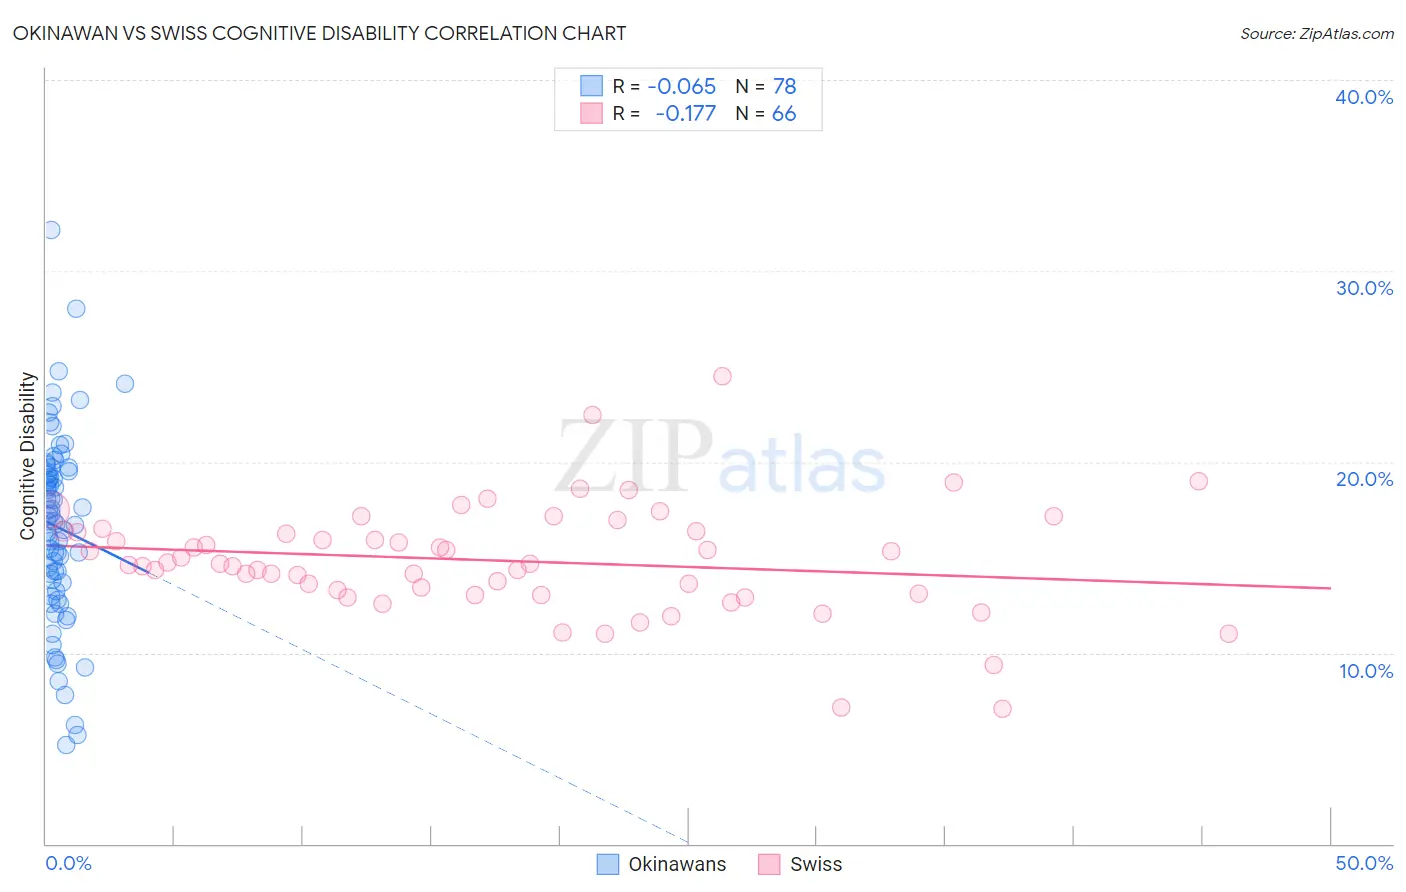
Okinawan vs Swiss Cognitive Disability Correlation Chart
The statistical analysis conducted on geographies consisting of 73,776,051 people shows a slight negative correlation between the proportion of Okinawans and percentage of population with cognitive disability in the United States with a correlation coefficient (R) of -0.065 and weighted average of 17.6%. Similarly, the statistical analysis conducted on geographies consisting of 464,991,468 people shows a poor negative correlation between the proportion of Swiss and percentage of population with cognitive disability in the United States with a correlation coefficient (R) of -0.177 and weighted average of 16.7%, a difference of 5.5%.
Cognitive Disability Correlation Summary
| Measurement | Okinawan | Swiss |
| Minimum | 5.1% | 7.0% |
| Maximum | 32.1% | 24.5% |
| Range | 27.0% | 17.5% |
| Mean | 16.6% | 14.8% |
| Median | 16.9% | 14.6% |
| Interquartile 25% (IQ1) | 13.7% | 13.1% |
| Interquartile 75% (IQ3) | 19.5% | 16.3% |
| Interquartile Range (IQR) | 5.8% | 3.2% |
| Standard Deviation (Sample) | 4.9% | 2.9% |
| Standard Deviation (Population) | 4.9% | 2.9% |
Similar Demographics by Cognitive Disability
Demographics Similar to Okinawans by Cognitive Disability
In terms of cognitive disability, the demographic groups most similar to Okinawans are Alaskan Athabascan (17.6%, a difference of 0.010%), Immigrants from El Salvador (17.6%, a difference of 0.020%), Salvadoran (17.6%, a difference of 0.020%), Hawaiian (17.6%, a difference of 0.040%), and Immigrants from Oceania (17.6%, a difference of 0.050%).
| Demographics | Rating | Rank | Cognitive Disability |
| Immigrants | Trinidad and Tobago | 8.7 /100 | #209 | Tragic 17.6% |
| Immigrants | Jamaica | 8.5 /100 | #210 | Tragic 17.6% |
| Taiwanese | 7.7 /100 | #211 | Tragic 17.6% |
| Immigrants | Oceania | 7.3 /100 | #212 | Tragic 17.6% |
| Hawaiians | 7.2 /100 | #213 | Tragic 17.6% |
| Immigrants | El Salvador | 7.0 /100 | #214 | Tragic 17.6% |
| Alaskan Athabascans | 6.9 /100 | #215 | Tragic 17.6% |
| Okinawans | 6.8 /100 | #216 | Tragic 17.6% |
| Salvadorans | 6.7 /100 | #217 | Tragic 17.6% |
| Icelanders | 6.4 /100 | #218 | Tragic 17.6% |
| Immigrants | Sierra Leone | 6.3 /100 | #219 | Tragic 17.6% |
| Zimbabweans | 6.1 /100 | #220 | Tragic 17.6% |
| Moroccans | 5.9 /100 | #221 | Tragic 17.6% |
| Central Americans | 4.5 /100 | #222 | Tragic 17.7% |
| Alsatians | 4.5 /100 | #223 | Tragic 17.7% |
Demographics Similar to Swiss by Cognitive Disability
In terms of cognitive disability, the demographic groups most similar to Swiss are Immigrants from Netherlands (16.7%, a difference of 0.030%), Egyptian (16.7%, a difference of 0.040%), Immigrants from Bulgaria (16.7%, a difference of 0.060%), Peruvian (16.7%, a difference of 0.070%), and Serbian (16.7%, a difference of 0.070%).
| Demographics | Rating | Rank | Cognitive Disability |
| Estonians | 99.3 /100 | #75 | Exceptional 16.7% |
| Immigrants | Serbia | 99.3 /100 | #76 | Exceptional 16.7% |
| Immigrants | Hungary | 99.3 /100 | #77 | Exceptional 16.7% |
| Peruvians | 99.3 /100 | #78 | Exceptional 16.7% |
| Immigrants | Bulgaria | 99.3 /100 | #79 | Exceptional 16.7% |
| Egyptians | 99.2 /100 | #80 | Exceptional 16.7% |
| Immigrants | Netherlands | 99.2 /100 | #81 | Exceptional 16.7% |
| Swiss | 99.2 /100 | #82 | Exceptional 16.7% |
| Serbians | 99.1 /100 | #83 | Exceptional 16.7% |
| Belgians | 99.1 /100 | #84 | Exceptional 16.7% |
| Immigrants | Moldova | 99.1 /100 | #85 | Exceptional 16.7% |
| Immigrants | South Africa | 99.0 /100 | #86 | Exceptional 16.7% |
| Native Hawaiians | 99.0 /100 | #87 | Exceptional 16.7% |
| Immigrants | Philippines | 99.0 /100 | #88 | Exceptional 16.7% |
| Immigrants | Egypt | 98.8 /100 | #89 | Exceptional 16.7% |