Okinawan vs Yakama Cognitive Disability
COMPARE
Okinawan
Yakama
Cognitive Disability
Cognitive Disability Comparison
Okinawans
Yakama
17.6%
COGNITIVE DISABILITY
6.8/ 100
METRIC RATING
216th/ 347
METRIC RANK
18.1%
COGNITIVE DISABILITY
0.1/ 100
METRIC RATING
281st/ 347
METRIC RANK
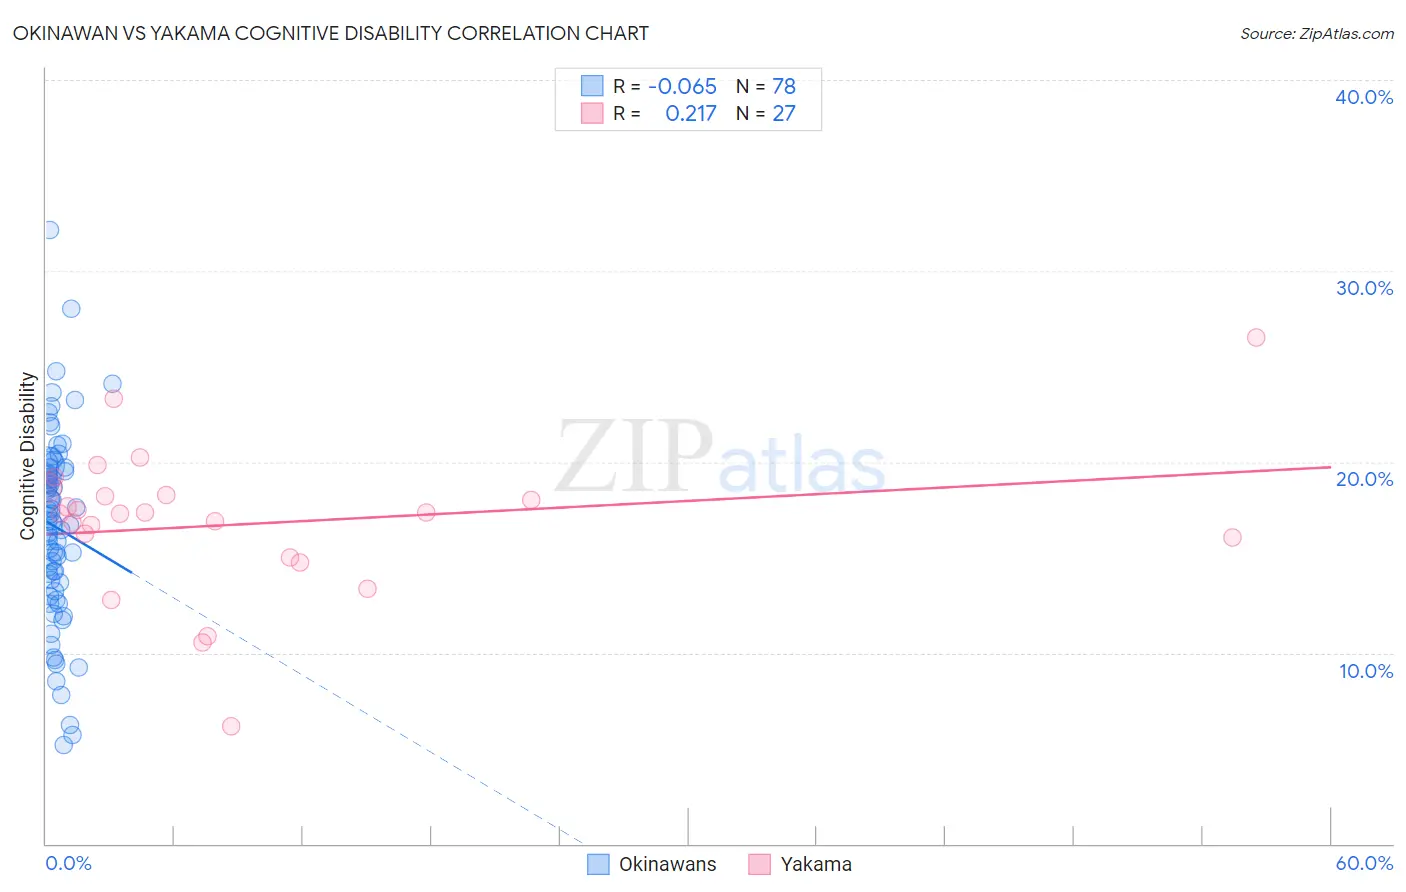
Okinawan vs Yakama Cognitive Disability Correlation Chart
The statistical analysis conducted on geographies consisting of 73,776,051 people shows a slight negative correlation between the proportion of Okinawans and percentage of population with cognitive disability in the United States with a correlation coefficient (R) of -0.065 and weighted average of 17.6%. Similarly, the statistical analysis conducted on geographies consisting of 19,917,879 people shows a weak positive correlation between the proportion of Yakama and percentage of population with cognitive disability in the United States with a correlation coefficient (R) of 0.217 and weighted average of 18.1%, a difference of 2.9%.
Cognitive Disability Correlation Summary
| Measurement | Okinawan | Yakama |
| Minimum | 5.1% | 6.1% |
| Maximum | 32.1% | 26.5% |
| Range | 27.0% | 20.4% |
| Mean | 16.6% | 16.8% |
| Median | 16.9% | 17.3% |
| Interquartile 25% (IQ1) | 13.7% | 15.0% |
| Interquartile 75% (IQ3) | 19.5% | 18.3% |
| Interquartile Range (IQR) | 5.8% | 3.3% |
| Standard Deviation (Sample) | 4.9% | 3.9% |
| Standard Deviation (Population) | 4.9% | 3.8% |
Similar Demographics by Cognitive Disability
Demographics Similar to Okinawans by Cognitive Disability
In terms of cognitive disability, the demographic groups most similar to Okinawans are Alaskan Athabascan (17.6%, a difference of 0.010%), Immigrants from El Salvador (17.6%, a difference of 0.020%), Salvadoran (17.6%, a difference of 0.020%), Hawaiian (17.6%, a difference of 0.040%), and Immigrants from Oceania (17.6%, a difference of 0.050%).
| Demographics | Rating | Rank | Cognitive Disability |
| Immigrants | Trinidad and Tobago | 8.7 /100 | #209 | Tragic 17.6% |
| Immigrants | Jamaica | 8.5 /100 | #210 | Tragic 17.6% |
| Taiwanese | 7.7 /100 | #211 | Tragic 17.6% |
| Immigrants | Oceania | 7.3 /100 | #212 | Tragic 17.6% |
| Hawaiians | 7.2 /100 | #213 | Tragic 17.6% |
| Immigrants | El Salvador | 7.0 /100 | #214 | Tragic 17.6% |
| Alaskan Athabascans | 6.9 /100 | #215 | Tragic 17.6% |
| Okinawans | 6.8 /100 | #216 | Tragic 17.6% |
| Salvadorans | 6.7 /100 | #217 | Tragic 17.6% |
| Icelanders | 6.4 /100 | #218 | Tragic 17.6% |
| Immigrants | Sierra Leone | 6.3 /100 | #219 | Tragic 17.6% |
| Zimbabweans | 6.1 /100 | #220 | Tragic 17.6% |
| Moroccans | 5.9 /100 | #221 | Tragic 17.6% |
| Central Americans | 4.5 /100 | #222 | Tragic 17.7% |
| Alsatians | 4.5 /100 | #223 | Tragic 17.7% |
Demographics Similar to Yakama by Cognitive Disability
In terms of cognitive disability, the demographic groups most similar to Yakama are Immigrants from Cambodia (18.1%, a difference of 0.020%), Nigerian (18.1%, a difference of 0.050%), Immigrants from Uganda (18.1%, a difference of 0.090%), Bermudan (18.1%, a difference of 0.10%), and West Indian (18.1%, a difference of 0.12%).
| Demographics | Rating | Rank | Cognitive Disability |
| Immigrants | Nigeria | 0.2 /100 | #274 | Tragic 18.0% |
| Immigrants | Laos | 0.2 /100 | #275 | Tragic 18.1% |
| Yuman | 0.2 /100 | #276 | Tragic 18.1% |
| Immigrants | Kuwait | 0.2 /100 | #277 | Tragic 18.1% |
| Immigrants | Micronesia | 0.2 /100 | #278 | Tragic 18.1% |
| Chippewa | 0.1 /100 | #279 | Tragic 18.1% |
| West Indians | 0.1 /100 | #280 | Tragic 18.1% |
| Yakama | 0.1 /100 | #281 | Tragic 18.1% |
| Immigrants | Cambodia | 0.1 /100 | #282 | Tragic 18.1% |
| Nigerians | 0.1 /100 | #283 | Tragic 18.1% |
| Immigrants | Uganda | 0.1 /100 | #284 | Tragic 18.1% |
| Bermudans | 0.1 /100 | #285 | Tragic 18.1% |
| Kenyans | 0.1 /100 | #286 | Tragic 18.1% |
| Dutch West Indians | 0.1 /100 | #287 | Tragic 18.1% |
| Immigrants | West Indies | 0.1 /100 | #288 | Tragic 18.1% |