Celtic vs Swiss Cognitive Disability
COMPARE
Celtic
Swiss
Cognitive Disability
Cognitive Disability Comparison
Celtics
Swiss
17.1%
COGNITIVE DISABILITY
74.1/ 100
METRIC RATING
158th/ 347
METRIC RANK
16.7%
COGNITIVE DISABILITY
99.2/ 100
METRIC RATING
82nd/ 347
METRIC RANK
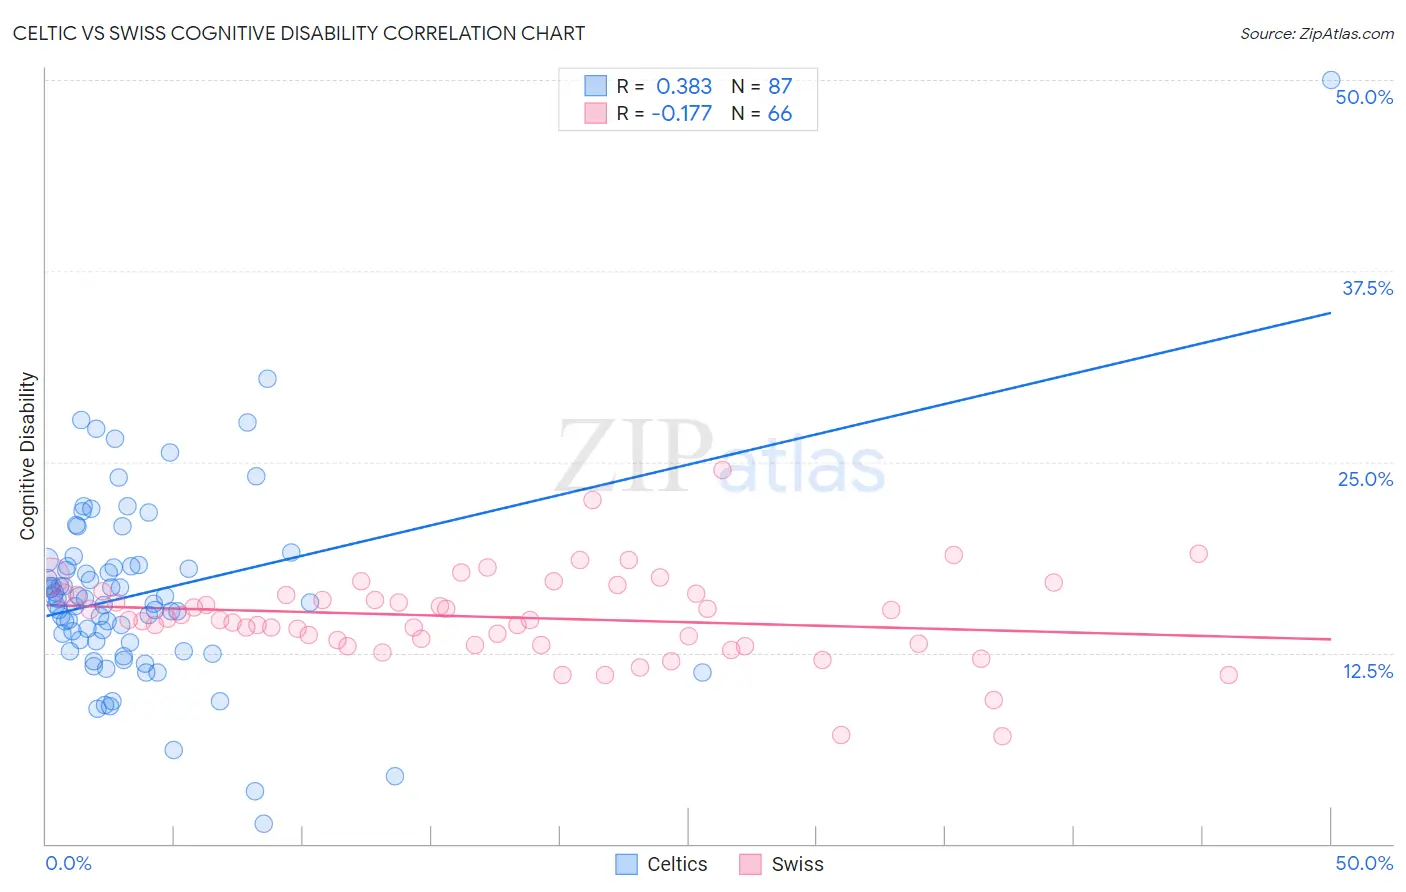
Celtic vs Swiss Cognitive Disability Correlation Chart
The statistical analysis conducted on geographies consisting of 168,858,493 people shows a mild positive correlation between the proportion of Celtics and percentage of population with cognitive disability in the United States with a correlation coefficient (R) of 0.383 and weighted average of 17.1%. Similarly, the statistical analysis conducted on geographies consisting of 464,991,468 people shows a poor negative correlation between the proportion of Swiss and percentage of population with cognitive disability in the United States with a correlation coefficient (R) of -0.177 and weighted average of 16.7%, a difference of 2.8%.
Cognitive Disability Correlation Summary
| Measurement | Celtic | Swiss |
| Minimum | 1.3% | 7.0% |
| Maximum | 50.0% | 24.5% |
| Range | 48.7% | 17.5% |
| Mean | 16.4% | 14.8% |
| Median | 15.8% | 14.6% |
| Interquartile 25% (IQ1) | 13.2% | 13.1% |
| Interquartile 75% (IQ3) | 18.2% | 16.3% |
| Interquartile Range (IQR) | 5.0% | 3.2% |
| Standard Deviation (Sample) | 6.4% | 2.9% |
| Standard Deviation (Population) | 6.3% | 2.9% |
Similar Demographics by Cognitive Disability
Demographics Similar to Celtics by Cognitive Disability
In terms of cognitive disability, the demographic groups most similar to Celtics are Immigrants from Latvia (17.2%, a difference of 0.030%), Australian (17.2%, a difference of 0.060%), Immigrants from Australia (17.1%, a difference of 0.070%), American (17.2%, a difference of 0.070%), and Yugoslavian (17.2%, a difference of 0.090%).
| Demographics | Rating | Rank | Cognitive Disability |
| Syrians | 83.0 /100 | #151 | Excellent 17.1% |
| Immigrants | Indonesia | 82.7 /100 | #152 | Excellent 17.1% |
| Immigrants | Kazakhstan | 80.5 /100 | #153 | Excellent 17.1% |
| Immigrants | Malaysia | 79.3 /100 | #154 | Good 17.1% |
| Brazilians | 78.9 /100 | #155 | Good 17.1% |
| Sri Lankans | 78.9 /100 | #156 | Good 17.1% |
| Immigrants | Australia | 76.0 /100 | #157 | Good 17.1% |
| Celtics | 74.1 /100 | #158 | Good 17.1% |
| Immigrants | Latvia | 73.2 /100 | #159 | Good 17.2% |
| Australians | 72.4 /100 | #160 | Good 17.2% |
| Americans | 72.2 /100 | #161 | Good 17.2% |
| Yugoslavians | 71.6 /100 | #162 | Good 17.2% |
| Immigrants | Switzerland | 71.5 /100 | #163 | Good 17.2% |
| Armenians | 70.1 /100 | #164 | Good 17.2% |
| Immigrants | Albania | 64.9 /100 | #165 | Good 17.2% |
Demographics Similar to Swiss by Cognitive Disability
In terms of cognitive disability, the demographic groups most similar to Swiss are Immigrants from Netherlands (16.7%, a difference of 0.030%), Egyptian (16.7%, a difference of 0.040%), Immigrants from Bulgaria (16.7%, a difference of 0.060%), Peruvian (16.7%, a difference of 0.070%), and Serbian (16.7%, a difference of 0.070%).
| Demographics | Rating | Rank | Cognitive Disability |
| Estonians | 99.3 /100 | #75 | Exceptional 16.7% |
| Immigrants | Serbia | 99.3 /100 | #76 | Exceptional 16.7% |
| Immigrants | Hungary | 99.3 /100 | #77 | Exceptional 16.7% |
| Peruvians | 99.3 /100 | #78 | Exceptional 16.7% |
| Immigrants | Bulgaria | 99.3 /100 | #79 | Exceptional 16.7% |
| Egyptians | 99.2 /100 | #80 | Exceptional 16.7% |
| Immigrants | Netherlands | 99.2 /100 | #81 | Exceptional 16.7% |
| Swiss | 99.2 /100 | #82 | Exceptional 16.7% |
| Serbians | 99.1 /100 | #83 | Exceptional 16.7% |
| Belgians | 99.1 /100 | #84 | Exceptional 16.7% |
| Immigrants | Moldova | 99.1 /100 | #85 | Exceptional 16.7% |
| Immigrants | South Africa | 99.0 /100 | #86 | Exceptional 16.7% |
| Native Hawaiians | 99.0 /100 | #87 | Exceptional 16.7% |
| Immigrants | Philippines | 99.0 /100 | #88 | Exceptional 16.7% |
| Immigrants | Egypt | 98.8 /100 | #89 | Exceptional 16.7% |