Immigrants from Sierra Leone vs Swiss Cognitive Disability
COMPARE
Immigrants from Sierra Leone
Swiss
Cognitive Disability
Cognitive Disability Comparison
Immigrants from Sierra Leone
Swiss
17.6%
COGNITIVE DISABILITY
6.3/ 100
METRIC RATING
219th/ 347
METRIC RANK
16.7%
COGNITIVE DISABILITY
99.2/ 100
METRIC RATING
82nd/ 347
METRIC RANK
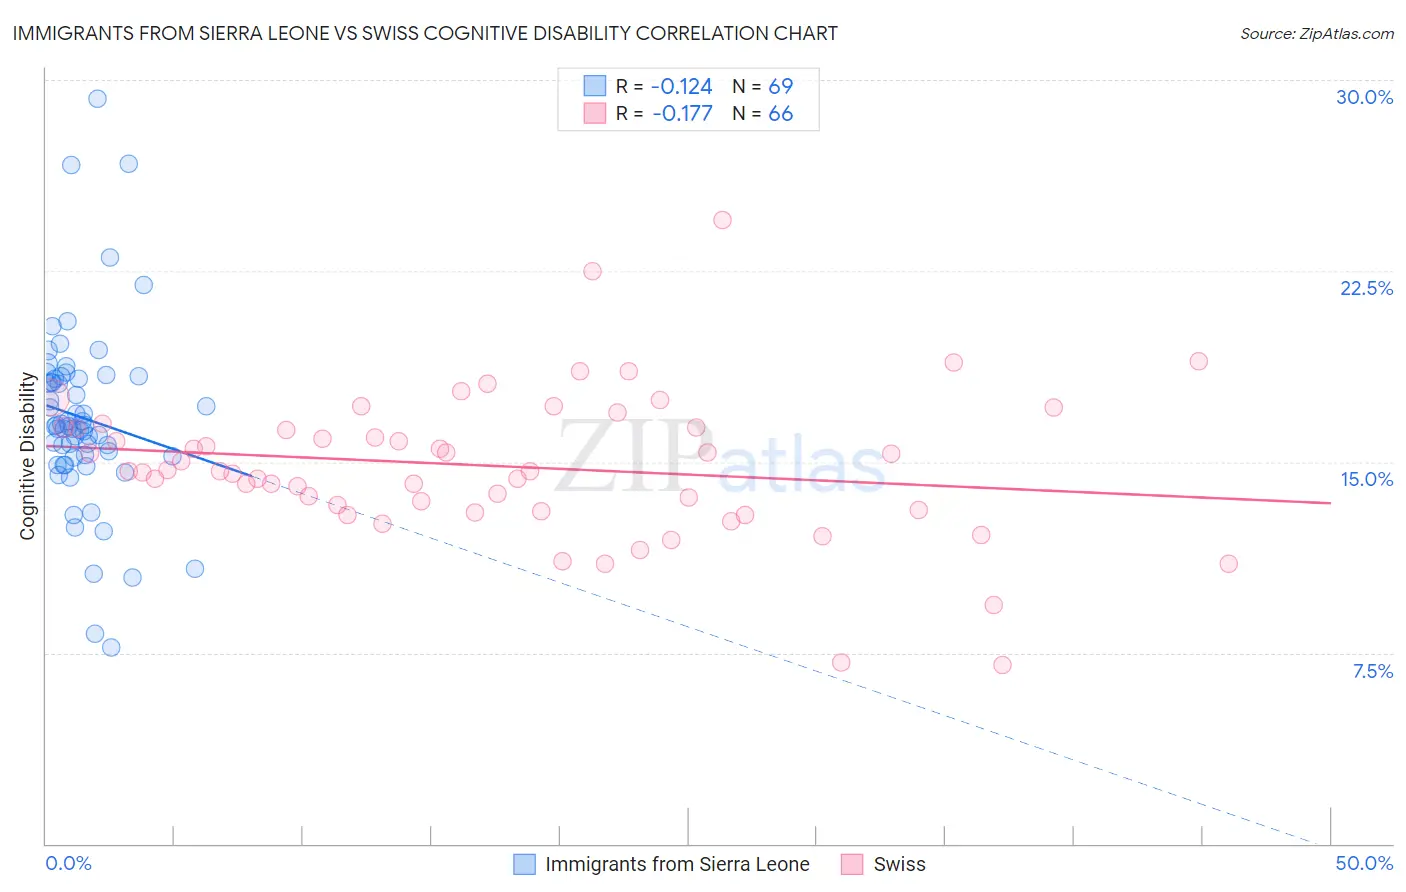
Immigrants from Sierra Leone vs Swiss Cognitive Disability Correlation Chart
The statistical analysis conducted on geographies consisting of 101,650,758 people shows a poor negative correlation between the proportion of Immigrants from Sierra Leone and percentage of population with cognitive disability in the United States with a correlation coefficient (R) of -0.124 and weighted average of 17.6%. Similarly, the statistical analysis conducted on geographies consisting of 464,991,468 people shows a poor negative correlation between the proportion of Swiss and percentage of population with cognitive disability in the United States with a correlation coefficient (R) of -0.177 and weighted average of 16.7%, a difference of 5.6%.
Cognitive Disability Correlation Summary
| Measurement | Immigrants from Sierra Leone | Swiss |
| Minimum | 7.7% | 7.0% |
| Maximum | 29.3% | 24.5% |
| Range | 21.6% | 17.5% |
| Mean | 16.7% | 14.8% |
| Median | 16.4% | 14.6% |
| Interquartile 25% (IQ1) | 15.2% | 13.1% |
| Interquartile 75% (IQ3) | 18.3% | 16.3% |
| Interquartile Range (IQR) | 3.1% | 3.2% |
| Standard Deviation (Sample) | 3.6% | 2.9% |
| Standard Deviation (Population) | 3.6% | 2.9% |
Similar Demographics by Cognitive Disability
Demographics Similar to Immigrants from Sierra Leone by Cognitive Disability
In terms of cognitive disability, the demographic groups most similar to Immigrants from Sierra Leone are Icelander (17.6%, a difference of 0.010%), Zimbabwean (17.6%, a difference of 0.030%), Salvadoran (17.6%, a difference of 0.040%), Moroccan (17.6%, a difference of 0.050%), and Okinawan (17.6%, a difference of 0.060%).
| Demographics | Rating | Rank | Cognitive Disability |
| Immigrants | Oceania | 7.3 /100 | #212 | Tragic 17.6% |
| Hawaiians | 7.2 /100 | #213 | Tragic 17.6% |
| Immigrants | El Salvador | 7.0 /100 | #214 | Tragic 17.6% |
| Alaskan Athabascans | 6.9 /100 | #215 | Tragic 17.6% |
| Okinawans | 6.8 /100 | #216 | Tragic 17.6% |
| Salvadorans | 6.7 /100 | #217 | Tragic 17.6% |
| Icelanders | 6.4 /100 | #218 | Tragic 17.6% |
| Immigrants | Sierra Leone | 6.3 /100 | #219 | Tragic 17.6% |
| Zimbabweans | 6.1 /100 | #220 | Tragic 17.6% |
| Moroccans | 5.9 /100 | #221 | Tragic 17.6% |
| Central Americans | 4.5 /100 | #222 | Tragic 17.7% |
| Alsatians | 4.5 /100 | #223 | Tragic 17.7% |
| Fijians | 3.4 /100 | #224 | Tragic 17.7% |
| Vietnamese | 3.4 /100 | #225 | Tragic 17.7% |
| Marshallese | 2.7 /100 | #226 | Tragic 17.7% |
Demographics Similar to Swiss by Cognitive Disability
In terms of cognitive disability, the demographic groups most similar to Swiss are Immigrants from Netherlands (16.7%, a difference of 0.030%), Egyptian (16.7%, a difference of 0.040%), Immigrants from Bulgaria (16.7%, a difference of 0.060%), Peruvian (16.7%, a difference of 0.070%), and Serbian (16.7%, a difference of 0.070%).
| Demographics | Rating | Rank | Cognitive Disability |
| Estonians | 99.3 /100 | #75 | Exceptional 16.7% |
| Immigrants | Serbia | 99.3 /100 | #76 | Exceptional 16.7% |
| Immigrants | Hungary | 99.3 /100 | #77 | Exceptional 16.7% |
| Peruvians | 99.3 /100 | #78 | Exceptional 16.7% |
| Immigrants | Bulgaria | 99.3 /100 | #79 | Exceptional 16.7% |
| Egyptians | 99.2 /100 | #80 | Exceptional 16.7% |
| Immigrants | Netherlands | 99.2 /100 | #81 | Exceptional 16.7% |
| Swiss | 99.2 /100 | #82 | Exceptional 16.7% |
| Serbians | 99.1 /100 | #83 | Exceptional 16.7% |
| Belgians | 99.1 /100 | #84 | Exceptional 16.7% |
| Immigrants | Moldova | 99.1 /100 | #85 | Exceptional 16.7% |
| Immigrants | South Africa | 99.0 /100 | #86 | Exceptional 16.7% |
| Native Hawaiians | 99.0 /100 | #87 | Exceptional 16.7% |
| Immigrants | Philippines | 99.0 /100 | #88 | Exceptional 16.7% |
| Immigrants | Egypt | 98.8 /100 | #89 | Exceptional 16.7% |