Okinawan vs African Cognitive Disability
COMPARE
Okinawan
African
Cognitive Disability
Cognitive Disability Comparison
Okinawans
Africans
17.6%
COGNITIVE DISABILITY
6.8/ 100
METRIC RATING
216th/ 347
METRIC RANK
18.6%
COGNITIVE DISABILITY
0.0/ 100
METRIC RATING
321st/ 347
METRIC RANK
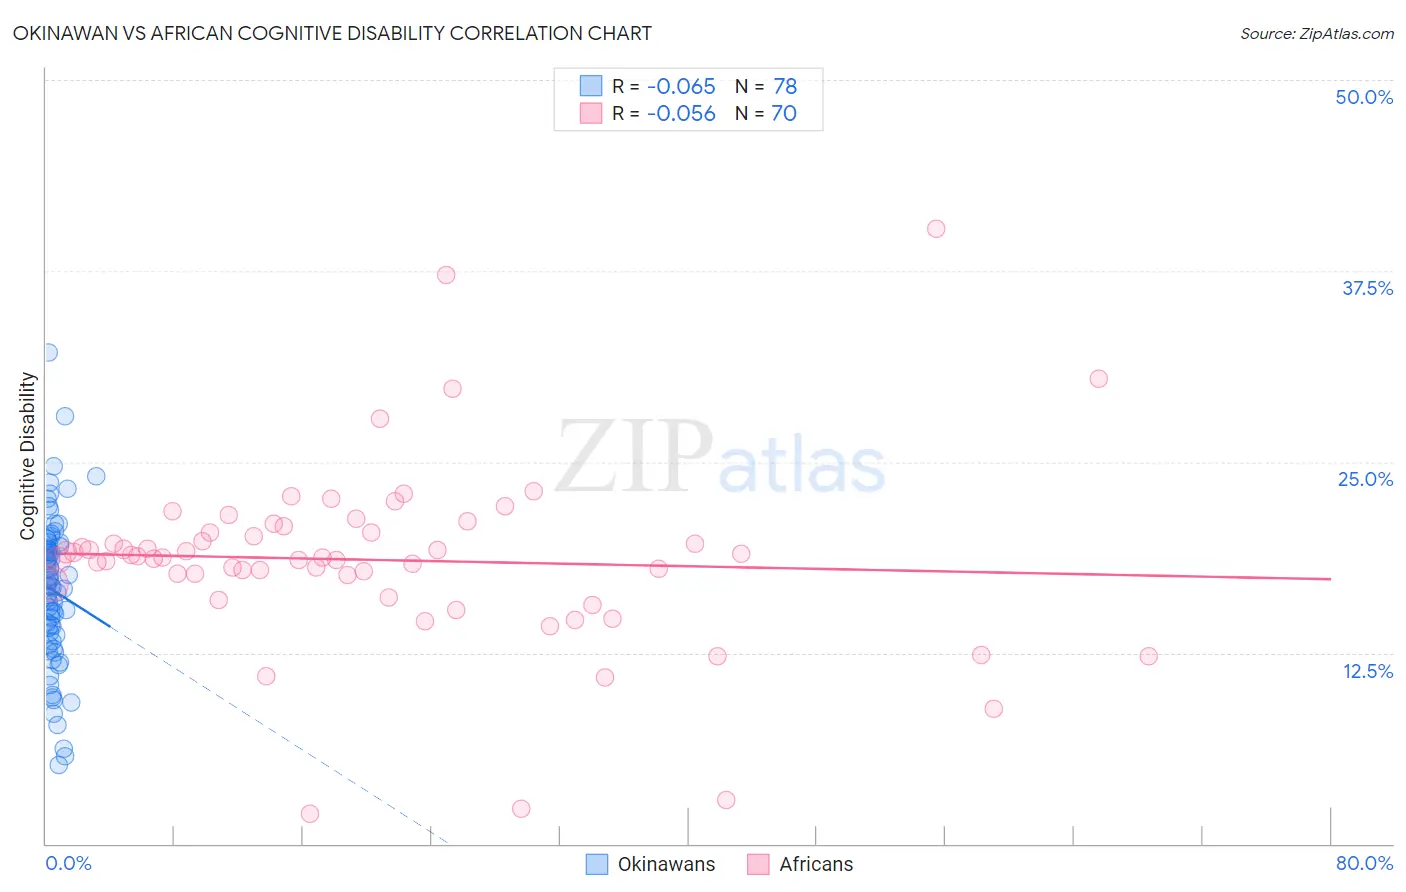
Okinawan vs African Cognitive Disability Correlation Chart
The statistical analysis conducted on geographies consisting of 73,776,051 people shows a slight negative correlation between the proportion of Okinawans and percentage of population with cognitive disability in the United States with a correlation coefficient (R) of -0.065 and weighted average of 17.6%. Similarly, the statistical analysis conducted on geographies consisting of 469,983,328 people shows a slight negative correlation between the proportion of Africans and percentage of population with cognitive disability in the United States with a correlation coefficient (R) of -0.056 and weighted average of 18.6%, a difference of 5.9%.
Cognitive Disability Correlation Summary
| Measurement | Okinawan | African |
| Minimum | 5.1% | 2.0% |
| Maximum | 32.1% | 40.3% |
| Range | 27.0% | 38.3% |
| Mean | 16.6% | 18.6% |
| Median | 16.9% | 18.8% |
| Interquartile 25% (IQ1) | 13.7% | 17.0% |
| Interquartile 75% (IQ3) | 19.5% | 20.4% |
| Interquartile Range (IQR) | 5.8% | 3.4% |
| Standard Deviation (Sample) | 4.9% | 6.1% |
| Standard Deviation (Population) | 4.9% | 6.0% |
Similar Demographics by Cognitive Disability
Demographics Similar to Okinawans by Cognitive Disability
In terms of cognitive disability, the demographic groups most similar to Okinawans are Alaskan Athabascan (17.6%, a difference of 0.010%), Immigrants from El Salvador (17.6%, a difference of 0.020%), Salvadoran (17.6%, a difference of 0.020%), Hawaiian (17.6%, a difference of 0.040%), and Immigrants from Oceania (17.6%, a difference of 0.050%).
| Demographics | Rating | Rank | Cognitive Disability |
| Immigrants | Trinidad and Tobago | 8.7 /100 | #209 | Tragic 17.6% |
| Immigrants | Jamaica | 8.5 /100 | #210 | Tragic 17.6% |
| Taiwanese | 7.7 /100 | #211 | Tragic 17.6% |
| Immigrants | Oceania | 7.3 /100 | #212 | Tragic 17.6% |
| Hawaiians | 7.2 /100 | #213 | Tragic 17.6% |
| Immigrants | El Salvador | 7.0 /100 | #214 | Tragic 17.6% |
| Alaskan Athabascans | 6.9 /100 | #215 | Tragic 17.6% |
| Okinawans | 6.8 /100 | #216 | Tragic 17.6% |
| Salvadorans | 6.7 /100 | #217 | Tragic 17.6% |
| Icelanders | 6.4 /100 | #218 | Tragic 17.6% |
| Immigrants | Sierra Leone | 6.3 /100 | #219 | Tragic 17.6% |
| Zimbabweans | 6.1 /100 | #220 | Tragic 17.6% |
| Moroccans | 5.9 /100 | #221 | Tragic 17.6% |
| Central Americans | 4.5 /100 | #222 | Tragic 17.7% |
| Alsatians | 4.5 /100 | #223 | Tragic 17.7% |
Demographics Similar to Africans by Cognitive Disability
In terms of cognitive disability, the demographic groups most similar to Africans are Immigrants from Liberia (18.7%, a difference of 0.060%), Pueblo (18.7%, a difference of 0.080%), Apache (18.6%, a difference of 0.090%), Comanche (18.6%, a difference of 0.13%), and Bangladeshi (18.6%, a difference of 0.17%).
| Demographics | Rating | Rank | Cognitive Disability |
| Sub-Saharan Africans | 0.0 /100 | #314 | Tragic 18.5% |
| Immigrants | Dominica | 0.0 /100 | #315 | Tragic 18.6% |
| Immigrants | Middle Africa | 0.0 /100 | #316 | Tragic 18.6% |
| Liberians | 0.0 /100 | #317 | Tragic 18.6% |
| Bangladeshis | 0.0 /100 | #318 | Tragic 18.6% |
| Comanche | 0.0 /100 | #319 | Tragic 18.6% |
| Apache | 0.0 /100 | #320 | Tragic 18.6% |
| Africans | 0.0 /100 | #321 | Tragic 18.6% |
| Immigrants | Liberia | 0.0 /100 | #322 | Tragic 18.7% |
| Pueblo | 0.0 /100 | #323 | Tragic 18.7% |
| Dominicans | 0.0 /100 | #324 | Tragic 18.7% |
| Indonesians | 0.0 /100 | #325 | Tragic 18.7% |
| Immigrants | Senegal | 0.0 /100 | #326 | Tragic 18.7% |
| U.S. Virgin Islanders | 0.0 /100 | #327 | Tragic 18.7% |
| Kiowa | 0.0 /100 | #328 | Tragic 18.7% |