Okinawan vs Dutch Cognitive Disability
COMPARE
Okinawan
Dutch
Cognitive Disability
Cognitive Disability Comparison
Okinawans
Dutch
17.6%
COGNITIVE DISABILITY
6.8/ 100
METRIC RATING
216th/ 347
METRIC RANK
16.8%
COGNITIVE DISABILITY
98.5/ 100
METRIC RATING
97th/ 347
METRIC RANK
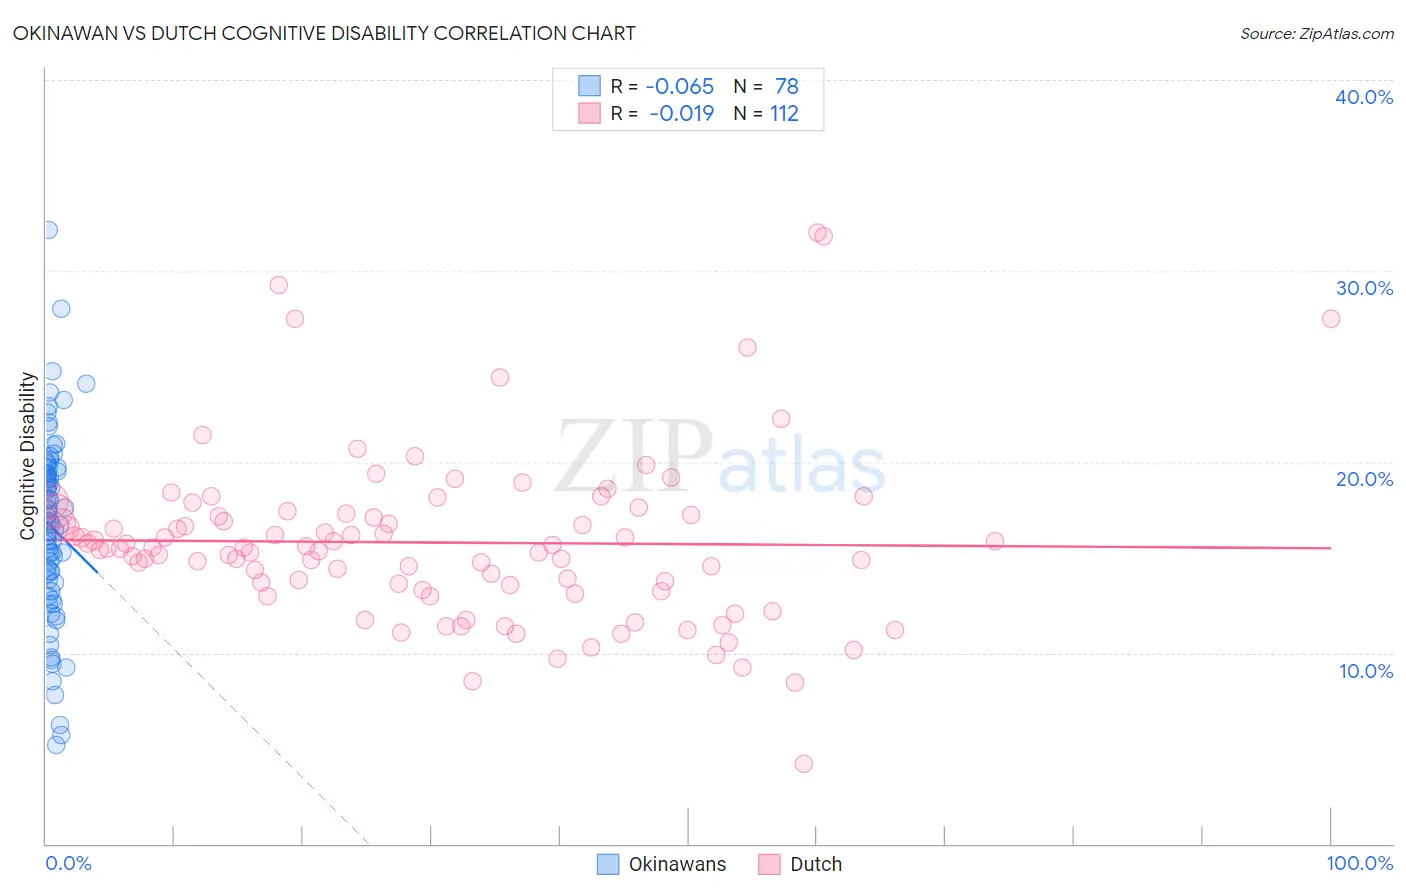
Okinawan vs Dutch Cognitive Disability Correlation Chart
The statistical analysis conducted on geographies consisting of 73,776,051 people shows a slight negative correlation between the proportion of Okinawans and percentage of population with cognitive disability in the United States with a correlation coefficient (R) of -0.065 and weighted average of 17.6%. Similarly, the statistical analysis conducted on geographies consisting of 554,237,240 people shows no correlation between the proportion of Dutch and percentage of population with cognitive disability in the United States with a correlation coefficient (R) of -0.019 and weighted average of 16.8%, a difference of 5.0%.
Cognitive Disability Correlation Summary
| Measurement | Okinawan | Dutch |
| Minimum | 5.1% | 4.2% |
| Maximum | 32.1% | 32.0% |
| Range | 27.0% | 27.8% |
| Mean | 16.6% | 15.8% |
| Median | 16.9% | 15.5% |
| Interquartile 25% (IQ1) | 13.7% | 13.4% |
| Interquartile 75% (IQ3) | 19.5% | 17.2% |
| Interquartile Range (IQR) | 5.8% | 3.9% |
| Standard Deviation (Sample) | 4.9% | 4.4% |
| Standard Deviation (Population) | 4.9% | 4.4% |
Similar Demographics by Cognitive Disability
Demographics Similar to Okinawans by Cognitive Disability
In terms of cognitive disability, the demographic groups most similar to Okinawans are Alaskan Athabascan (17.6%, a difference of 0.010%), Immigrants from El Salvador (17.6%, a difference of 0.020%), Salvadoran (17.6%, a difference of 0.020%), Hawaiian (17.6%, a difference of 0.040%), and Immigrants from Oceania (17.6%, a difference of 0.050%).
| Demographics | Rating | Rank | Cognitive Disability |
| Immigrants | Trinidad and Tobago | 8.7 /100 | #209 | Tragic 17.6% |
| Immigrants | Jamaica | 8.5 /100 | #210 | Tragic 17.6% |
| Taiwanese | 7.7 /100 | #211 | Tragic 17.6% |
| Immigrants | Oceania | 7.3 /100 | #212 | Tragic 17.6% |
| Hawaiians | 7.2 /100 | #213 | Tragic 17.6% |
| Immigrants | El Salvador | 7.0 /100 | #214 | Tragic 17.6% |
| Alaskan Athabascans | 6.9 /100 | #215 | Tragic 17.6% |
| Okinawans | 6.8 /100 | #216 | Tragic 17.6% |
| Salvadorans | 6.7 /100 | #217 | Tragic 17.6% |
| Icelanders | 6.4 /100 | #218 | Tragic 17.6% |
| Immigrants | Sierra Leone | 6.3 /100 | #219 | Tragic 17.6% |
| Zimbabweans | 6.1 /100 | #220 | Tragic 17.6% |
| Moroccans | 5.9 /100 | #221 | Tragic 17.6% |
| Central Americans | 4.5 /100 | #222 | Tragic 17.7% |
| Alsatians | 4.5 /100 | #223 | Tragic 17.7% |
Demographics Similar to Dutch by Cognitive Disability
In terms of cognitive disability, the demographic groups most similar to Dutch are Finnish (16.8%, a difference of 0.010%), Immigrants from Lebanon (16.8%, a difference of 0.020%), English (16.8%, a difference of 0.040%), Asian (16.7%, a difference of 0.10%), and Jordanian (16.8%, a difference of 0.11%).
| Demographics | Rating | Rank | Cognitive Disability |
| South Americans | 98.8 /100 | #90 | Exceptional 16.7% |
| Danes | 98.8 /100 | #91 | Exceptional 16.7% |
| Immigrants | South America | 98.8 /100 | #92 | Exceptional 16.7% |
| Immigrants | Southern Europe | 98.7 /100 | #93 | Exceptional 16.7% |
| Asians | 98.7 /100 | #94 | Exceptional 16.7% |
| English | 98.6 /100 | #95 | Exceptional 16.8% |
| Finns | 98.5 /100 | #96 | Exceptional 16.8% |
| Dutch | 98.5 /100 | #97 | Exceptional 16.8% |
| Immigrants | Lebanon | 98.4 /100 | #98 | Exceptional 16.8% |
| Jordanians | 98.2 /100 | #99 | Exceptional 16.8% |
| Immigrants | Russia | 98.2 /100 | #100 | Exceptional 16.8% |
| Immigrants | Asia | 98.1 /100 | #101 | Exceptional 16.8% |
| Irish | 98.1 /100 | #102 | Exceptional 16.8% |
| Paraguayans | 98.0 /100 | #103 | Exceptional 16.8% |
| Palestinians | 98.0 /100 | #104 | Exceptional 16.8% |