Okinawan vs Immigrants from France Cognitive Disability
COMPARE
Okinawan
Immigrants from France
Cognitive Disability
Cognitive Disability Comparison
Okinawans
Immigrants from France
17.6%
COGNITIVE DISABILITY
6.8/ 100
METRIC RATING
216th/ 347
METRIC RANK
17.4%
COGNITIVE DISABILITY
29.8/ 100
METRIC RATING
188th/ 347
METRIC RANK
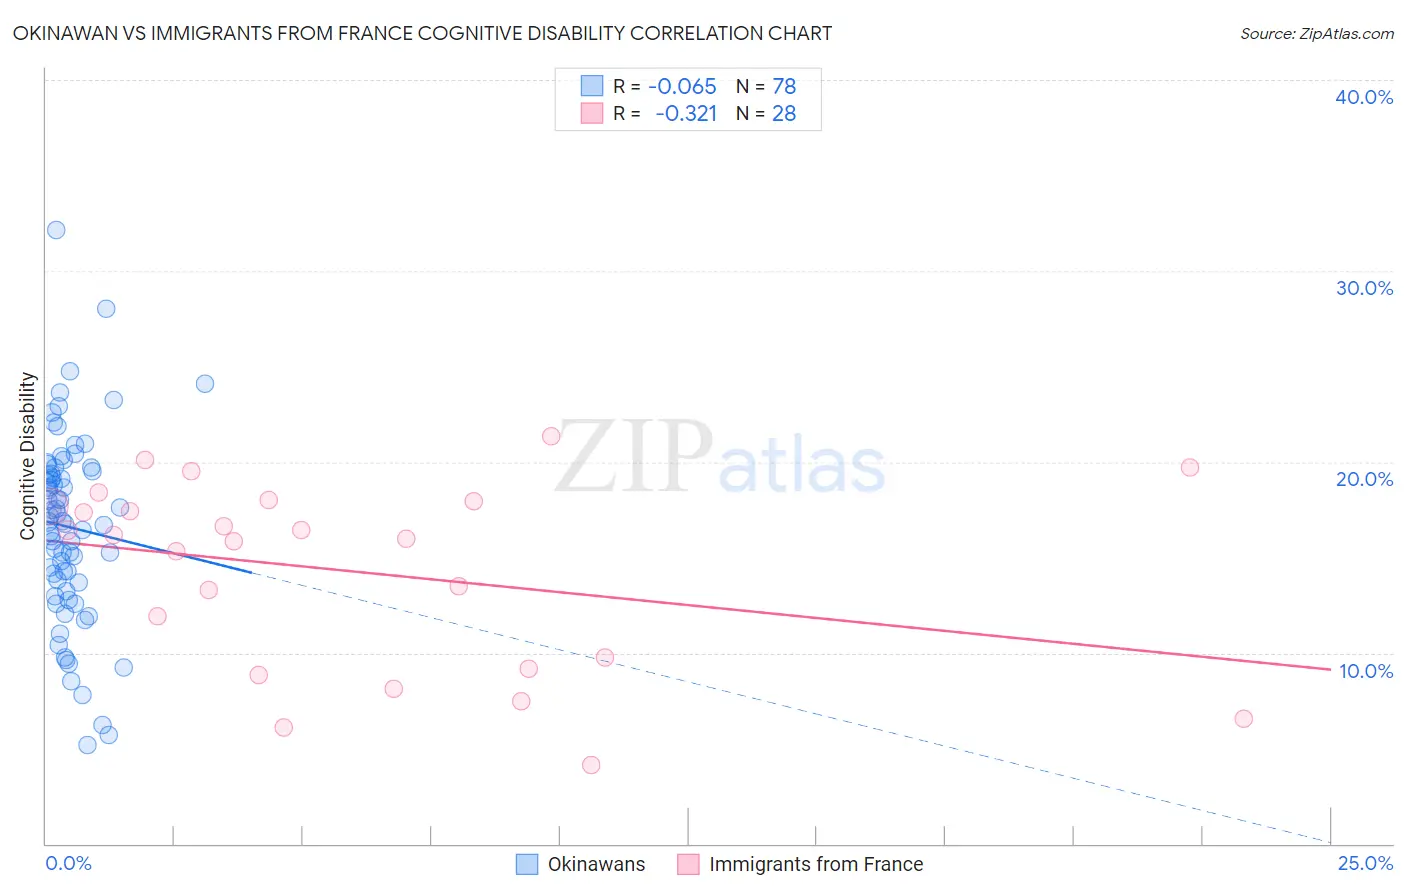
Okinawan vs Immigrants from France Cognitive Disability Correlation Chart
The statistical analysis conducted on geographies consisting of 73,776,051 people shows a slight negative correlation between the proportion of Okinawans and percentage of population with cognitive disability in the United States with a correlation coefficient (R) of -0.065 and weighted average of 17.6%. Similarly, the statistical analysis conducted on geographies consisting of 287,908,122 people shows a mild negative correlation between the proportion of Immigrants from France and percentage of population with cognitive disability in the United States with a correlation coefficient (R) of -0.321 and weighted average of 17.4%, a difference of 1.2%.
Cognitive Disability Correlation Summary
| Measurement | Okinawan | Immigrants from France |
| Minimum | 5.1% | 4.1% |
| Maximum | 32.1% | 21.3% |
| Range | 27.0% | 17.2% |
| Mean | 16.6% | 14.3% |
| Median | 16.9% | 16.1% |
| Interquartile 25% (IQ1) | 13.7% | 9.5% |
| Interquartile 75% (IQ3) | 19.5% | 17.8% |
| Interquartile Range (IQR) | 5.8% | 8.3% |
| Standard Deviation (Sample) | 4.9% | 4.9% |
| Standard Deviation (Population) | 4.9% | 4.8% |
Similar Demographics by Cognitive Disability
Demographics Similar to Okinawans by Cognitive Disability
In terms of cognitive disability, the demographic groups most similar to Okinawans are Alaskan Athabascan (17.6%, a difference of 0.010%), Immigrants from El Salvador (17.6%, a difference of 0.020%), Salvadoran (17.6%, a difference of 0.020%), Hawaiian (17.6%, a difference of 0.040%), and Immigrants from Oceania (17.6%, a difference of 0.050%).
| Demographics | Rating | Rank | Cognitive Disability |
| Immigrants | Trinidad and Tobago | 8.7 /100 | #209 | Tragic 17.6% |
| Immigrants | Jamaica | 8.5 /100 | #210 | Tragic 17.6% |
| Taiwanese | 7.7 /100 | #211 | Tragic 17.6% |
| Immigrants | Oceania | 7.3 /100 | #212 | Tragic 17.6% |
| Hawaiians | 7.2 /100 | #213 | Tragic 17.6% |
| Immigrants | El Salvador | 7.0 /100 | #214 | Tragic 17.6% |
| Alaskan Athabascans | 6.9 /100 | #215 | Tragic 17.6% |
| Okinawans | 6.8 /100 | #216 | Tragic 17.6% |
| Salvadorans | 6.7 /100 | #217 | Tragic 17.6% |
| Icelanders | 6.4 /100 | #218 | Tragic 17.6% |
| Immigrants | Sierra Leone | 6.3 /100 | #219 | Tragic 17.6% |
| Zimbabweans | 6.1 /100 | #220 | Tragic 17.6% |
| Moroccans | 5.9 /100 | #221 | Tragic 17.6% |
| Central Americans | 4.5 /100 | #222 | Tragic 17.7% |
| Alsatians | 4.5 /100 | #223 | Tragic 17.7% |
Demographics Similar to Immigrants from France by Cognitive Disability
In terms of cognitive disability, the demographic groups most similar to Immigrants from France are Immigrants from Western Asia (17.4%, a difference of 0.010%), Immigrants from Spain (17.4%, a difference of 0.070%), Nonimmigrants (17.4%, a difference of 0.080%), Immigrants from Haiti (17.4%, a difference of 0.090%), and Immigrants from Fiji (17.4%, a difference of 0.13%).
| Demographics | Rating | Rank | Cognitive Disability |
| Immigrants | Guyana | 42.9 /100 | #181 | Average 17.3% |
| Arabs | 42.8 /100 | #182 | Average 17.3% |
| Spaniards | 40.3 /100 | #183 | Average 17.3% |
| Crow | 39.1 /100 | #184 | Fair 17.3% |
| Afghans | 38.2 /100 | #185 | Fair 17.3% |
| Cambodians | 35.9 /100 | #186 | Fair 17.3% |
| Immigrants | Fiji | 33.7 /100 | #187 | Fair 17.4% |
| Immigrants | France | 29.8 /100 | #188 | Fair 17.4% |
| Immigrants | Western Asia | 29.5 /100 | #189 | Fair 17.4% |
| Immigrants | Spain | 27.7 /100 | #190 | Fair 17.4% |
| Immigrants | Nonimmigrants | 27.4 /100 | #191 | Fair 17.4% |
| Immigrants | Haiti | 27.1 /100 | #192 | Fair 17.4% |
| Delaware | 25.6 /100 | #193 | Fair 17.4% |
| Immigrants | Bosnia and Herzegovina | 22.0 /100 | #194 | Fair 17.4% |
| New Zealanders | 21.1 /100 | #195 | Fair 17.4% |