Sioux vs Indian (Asian) Hearing Disability
COMPARE
Sioux
Indian (Asian)
Hearing Disability
Hearing Disability Comparison
Sioux
Indians (Asian)
3.6%
HEARING DISABILITY
0.0/ 100
METRIC RATING
285th/ 347
METRIC RANK
2.7%
HEARING DISABILITY
98.4/ 100
METRIC RATING
63rd/ 347
METRIC RANK
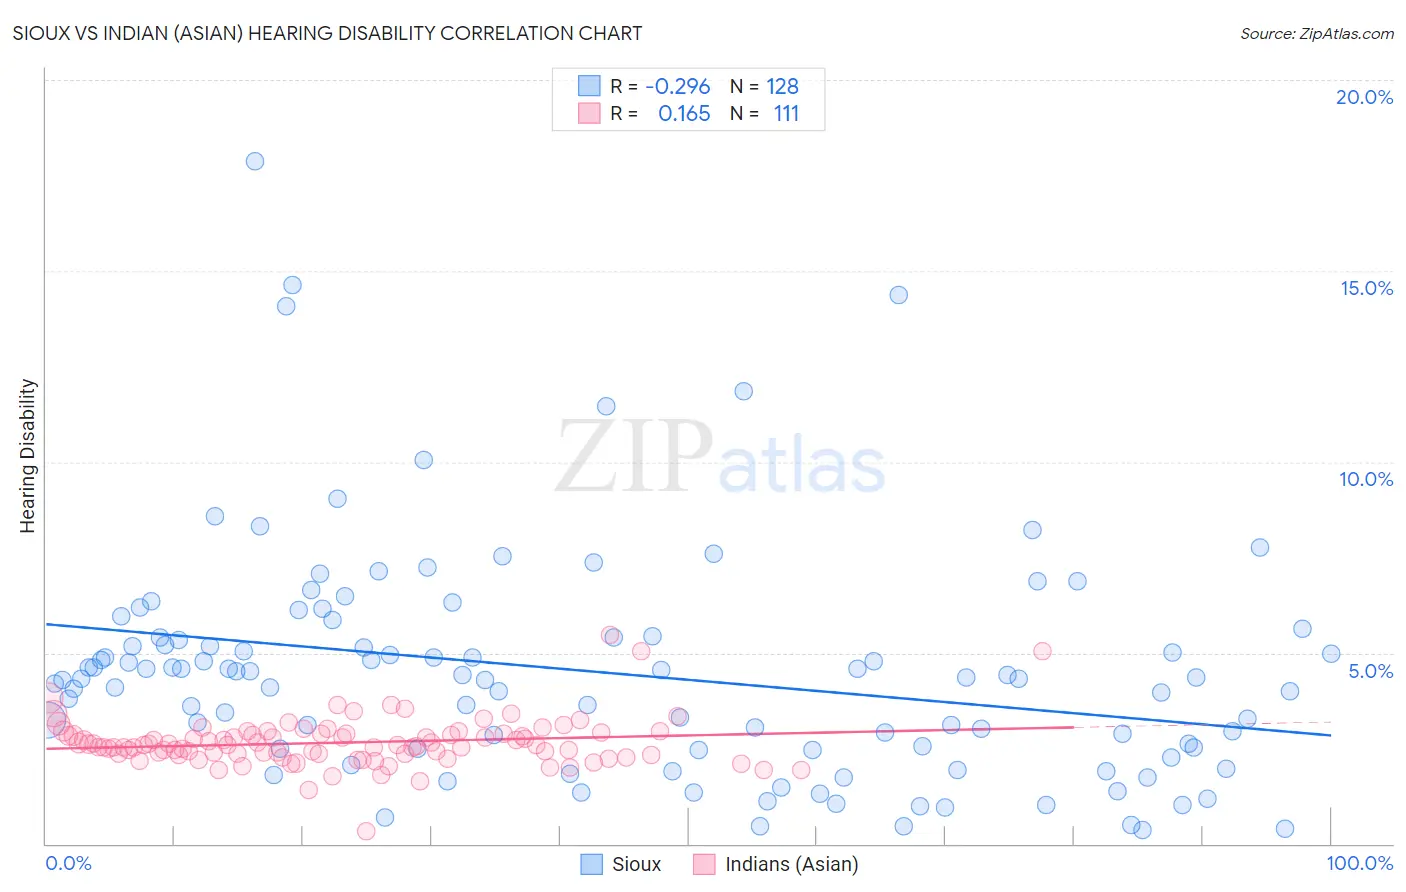
Sioux vs Indian (Asian) Hearing Disability Correlation Chart
The statistical analysis conducted on geographies consisting of 234,128,884 people shows a weak negative correlation between the proportion of Sioux and percentage of population with hearing disability in the United States with a correlation coefficient (R) of -0.296 and weighted average of 3.6%. Similarly, the statistical analysis conducted on geographies consisting of 494,958,947 people shows a poor positive correlation between the proportion of Indians (Asian) and percentage of population with hearing disability in the United States with a correlation coefficient (R) of 0.165 and weighted average of 2.7%, a difference of 34.5%.
Hearing Disability Correlation Summary
| Measurement | Sioux | Indian (Asian) |
| Minimum | 0.37% | 0.32% |
| Maximum | 17.9% | 5.5% |
| Range | 17.5% | 5.1% |
| Mean | 4.5% | 2.6% |
| Median | 4.3% | 2.6% |
| Interquartile 25% (IQ1) | 2.5% | 2.3% |
| Interquartile 75% (IQ3) | 5.4% | 2.9% |
| Interquartile Range (IQR) | 2.9% | 0.54% |
| Standard Deviation (Sample) | 3.0% | 0.64% |
| Standard Deviation (Population) | 3.0% | 0.64% |
Similar Demographics by Hearing Disability
Demographics Similar to Sioux by Hearing Disability
In terms of hearing disability, the demographic groups most similar to Sioux are Delaware (3.6%, a difference of 0.030%), Immigrants from Micronesia (3.6%, a difference of 0.10%), Spanish (3.7%, a difference of 0.28%), Blackfeet (3.6%, a difference of 0.57%), and Swedish (3.6%, a difference of 0.82%).
| Demographics | Rating | Rank | Hearing Disability |
| Basques | 0.0 /100 | #278 | Tragic 3.6% |
| Slovaks | 0.0 /100 | #279 | Tragic 3.6% |
| French American Indians | 0.0 /100 | #280 | Tragic 3.6% |
| Scandinavians | 0.0 /100 | #281 | Tragic 3.6% |
| Swedes | 0.0 /100 | #282 | Tragic 3.6% |
| Blackfeet | 0.0 /100 | #283 | Tragic 3.6% |
| Immigrants | Micronesia | 0.0 /100 | #284 | Tragic 3.6% |
| Sioux | 0.0 /100 | #285 | Tragic 3.6% |
| Delaware | 0.0 /100 | #286 | Tragic 3.6% |
| Spanish | 0.0 /100 | #287 | Tragic 3.7% |
| Irish | 0.0 /100 | #288 | Tragic 3.7% |
| Chinese | 0.0 /100 | #289 | Tragic 3.7% |
| Whites/Caucasians | 0.0 /100 | #290 | Tragic 3.7% |
| Finns | 0.0 /100 | #291 | Tragic 3.7% |
| Native Hawaiians | 0.0 /100 | #292 | Tragic 3.7% |
Demographics Similar to Indians (Asian) by Hearing Disability
In terms of hearing disability, the demographic groups most similar to Indians (Asian) are Immigrants from Colombia (2.7%, a difference of 0.050%), Immigrants from Sri Lanka (2.7%, a difference of 0.050%), Immigrants from Uzbekistan (2.7%, a difference of 0.060%), Immigrants from Nepal (2.7%, a difference of 0.14%), and Immigrants from Egypt (2.7%, a difference of 0.19%).
| Demographics | Rating | Rank | Hearing Disability |
| Immigrants | Nicaragua | 99.0 /100 | #56 | Exceptional 2.7% |
| South Americans | 99.0 /100 | #57 | Exceptional 2.7% |
| Immigrants | Peru | 98.6 /100 | #58 | Exceptional 2.7% |
| Immigrants | Eritrea | 98.5 /100 | #59 | Exceptional 2.7% |
| Immigrants | Egypt | 98.5 /100 | #60 | Exceptional 2.7% |
| Immigrants | Uzbekistan | 98.4 /100 | #61 | Exceptional 2.7% |
| Immigrants | Colombia | 98.4 /100 | #62 | Exceptional 2.7% |
| Indians (Asian) | 98.4 /100 | #63 | Exceptional 2.7% |
| Immigrants | Sri Lanka | 98.4 /100 | #64 | Exceptional 2.7% |
| Immigrants | Nepal | 98.3 /100 | #65 | Exceptional 2.7% |
| Immigrants | Belize | 98.2 /100 | #66 | Exceptional 2.7% |
| Egyptians | 98.1 /100 | #67 | Exceptional 2.7% |
| Immigrants | Africa | 98.0 /100 | #68 | Exceptional 2.7% |
| Nicaraguans | 97.9 /100 | #69 | Exceptional 2.7% |
| Peruvians | 97.7 /100 | #70 | Exceptional 2.7% |