Norwegian vs Hawaiian Master's Degree
COMPARE
Norwegian
Hawaiian
Master's Degree
Master's Degree Comparison
Norwegians
Hawaiians
14.0%
MASTER'S DEGREE
13.6/ 100
METRIC RATING
219th/ 347
METRIC RANK
11.6%
MASTER'S DEGREE
0.1/ 100
METRIC RATING
294th/ 347
METRIC RANK
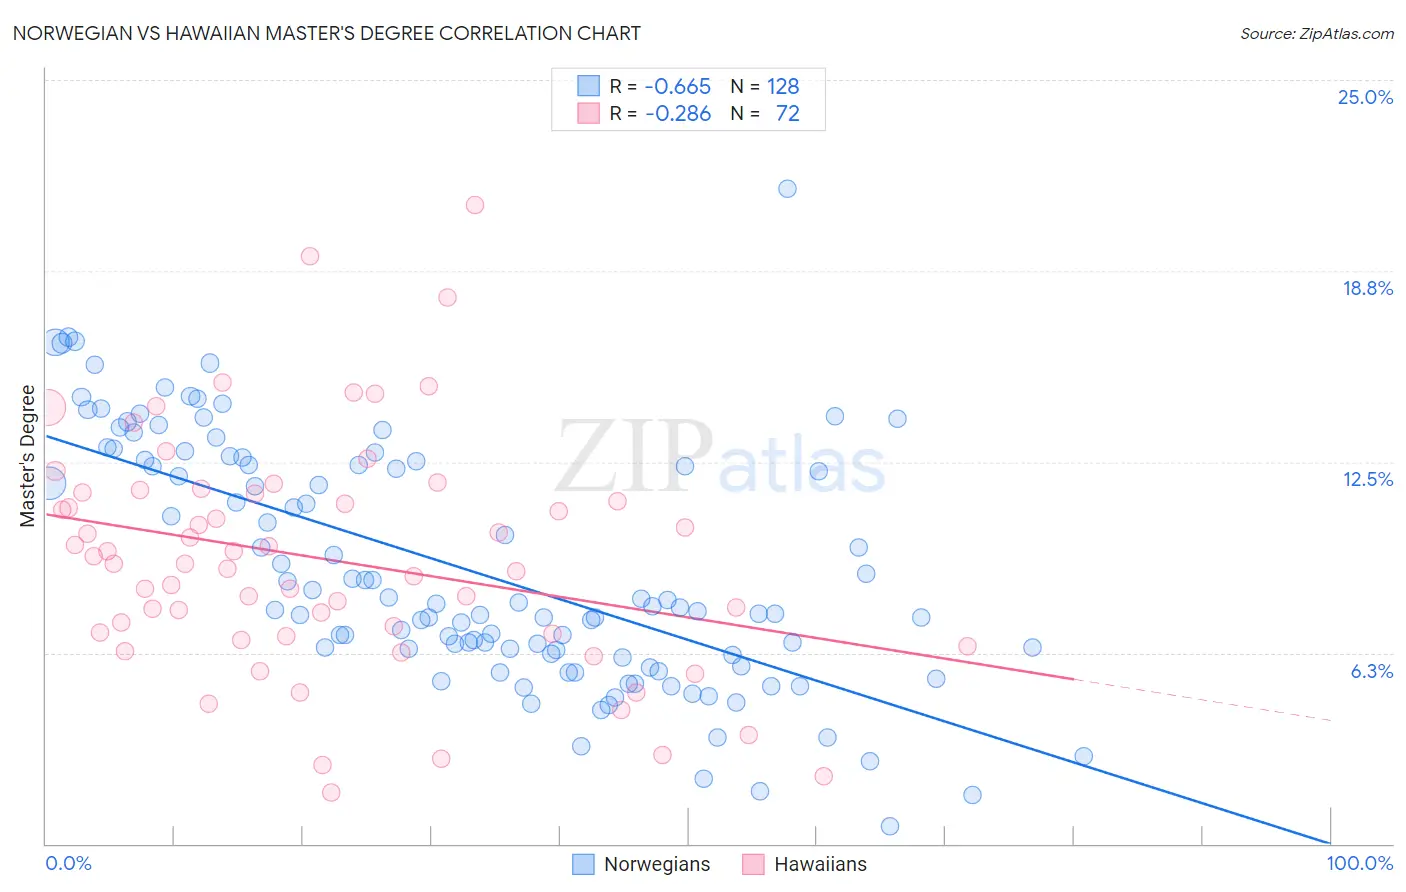
Norwegian vs Hawaiian Master's Degree Correlation Chart
The statistical analysis conducted on geographies consisting of 532,895,610 people shows a significant negative correlation between the proportion of Norwegians and percentage of population with at least master's degree education in the United States with a correlation coefficient (R) of -0.665 and weighted average of 14.0%. Similarly, the statistical analysis conducted on geographies consisting of 327,485,009 people shows a weak negative correlation between the proportion of Hawaiians and percentage of population with at least master's degree education in the United States with a correlation coefficient (R) of -0.286 and weighted average of 11.6%, a difference of 21.1%.
Master's Degree Correlation Summary
| Measurement | Norwegian | Hawaiian |
| Minimum | 0.57% | 1.7% |
| Maximum | 21.5% | 20.9% |
| Range | 20.9% | 19.2% |
| Mean | 9.0% | 9.3% |
| Median | 7.8% | 9.2% |
| Interquartile 25% (IQ1) | 6.2% | 6.8% |
| Interquartile 75% (IQ3) | 12.5% | 11.5% |
| Interquartile Range (IQR) | 6.3% | 4.7% |
| Standard Deviation (Sample) | 4.0% | 3.9% |
| Standard Deviation (Population) | 4.0% | 3.8% |
Similar Demographics by Master's Degree
Demographics Similar to Norwegians by Master's Degree
In terms of master's degree, the demographic groups most similar to Norwegians are German (14.0%, a difference of 0.15%), Korean (14.0%, a difference of 0.29%), Ecuadorian (14.0%, a difference of 0.32%), French Canadian (14.1%, a difference of 0.35%), and Immigrants from South Eastern Asia (14.0%, a difference of 0.52%).
| Demographics | Rating | Rank | Master's Degree |
| Spanish | 17.8 /100 | #212 | Poor 14.2% |
| Immigrants | Thailand | 17.0 /100 | #213 | Poor 14.2% |
| Finns | 16.9 /100 | #214 | Poor 14.2% |
| Immigrants | Vietnam | 16.1 /100 | #215 | Poor 14.1% |
| Immigrants | Somalia | 15.8 /100 | #216 | Poor 14.1% |
| Immigrants | Trinidad and Tobago | 15.8 /100 | #217 | Poor 14.1% |
| French Canadians | 14.9 /100 | #218 | Poor 14.1% |
| Norwegians | 13.6 /100 | #219 | Poor 14.0% |
| Germans | 13.1 /100 | #220 | Poor 14.0% |
| Koreans | 12.7 /100 | #221 | Poor 14.0% |
| Ecuadorians | 12.6 /100 | #222 | Poor 14.0% |
| Immigrants | South Eastern Asia | 11.9 /100 | #223 | Poor 14.0% |
| Immigrants | Grenada | 11.8 /100 | #224 | Poor 14.0% |
| Portuguese | 11.2 /100 | #225 | Poor 13.9% |
| Immigrants | St. Vincent and the Grenadines | 11.0 /100 | #226 | Poor 13.9% |
Demographics Similar to Hawaiians by Master's Degree
In terms of master's degree, the demographic groups most similar to Hawaiians are Alaska Native (11.6%, a difference of 0.10%), Marshallese (11.6%, a difference of 0.15%), Alaskan Athabascan (11.6%, a difference of 0.16%), Immigrants from Yemen (11.6%, a difference of 0.28%), and Immigrants from Guatemala (11.6%, a difference of 0.32%).
| Demographics | Rating | Rank | Master's Degree |
| Immigrants | Haiti | 0.1 /100 | #287 | Tragic 11.8% |
| Immigrants | Honduras | 0.1 /100 | #288 | Tragic 11.8% |
| Guatemalans | 0.1 /100 | #289 | Tragic 11.7% |
| Ute | 0.1 /100 | #290 | Tragic 11.7% |
| Colville | 0.1 /100 | #291 | Tragic 11.6% |
| Immigrants | Guatemala | 0.1 /100 | #292 | Tragic 11.6% |
| Alaska Natives | 0.1 /100 | #293 | Tragic 11.6% |
| Hawaiians | 0.1 /100 | #294 | Tragic 11.6% |
| Marshallese | 0.1 /100 | #295 | Tragic 11.6% |
| Alaskan Athabascans | 0.1 /100 | #296 | Tragic 11.6% |
| Immigrants | Yemen | 0.1 /100 | #297 | Tragic 11.6% |
| Samoans | 0.1 /100 | #298 | Tragic 11.5% |
| Chickasaw | 0.1 /100 | #299 | Tragic 11.4% |
| Chippewa | 0.1 /100 | #300 | Tragic 11.4% |
| Tsimshian | 0.1 /100 | #301 | Tragic 11.4% |