Palestinian vs Immigrants from Zimbabwe Ambulatory Disability
COMPARE
Palestinian
Immigrants from Zimbabwe
Ambulatory Disability
Ambulatory Disability Comparison
Palestinians
Immigrants from Zimbabwe
5.7%
AMBULATORY DISABILITY
99.2/ 100
METRIC RATING
82nd/ 347
METRIC RANK
5.6%
AMBULATORY DISABILITY
99.8/ 100
METRIC RATING
58th/ 347
METRIC RANK
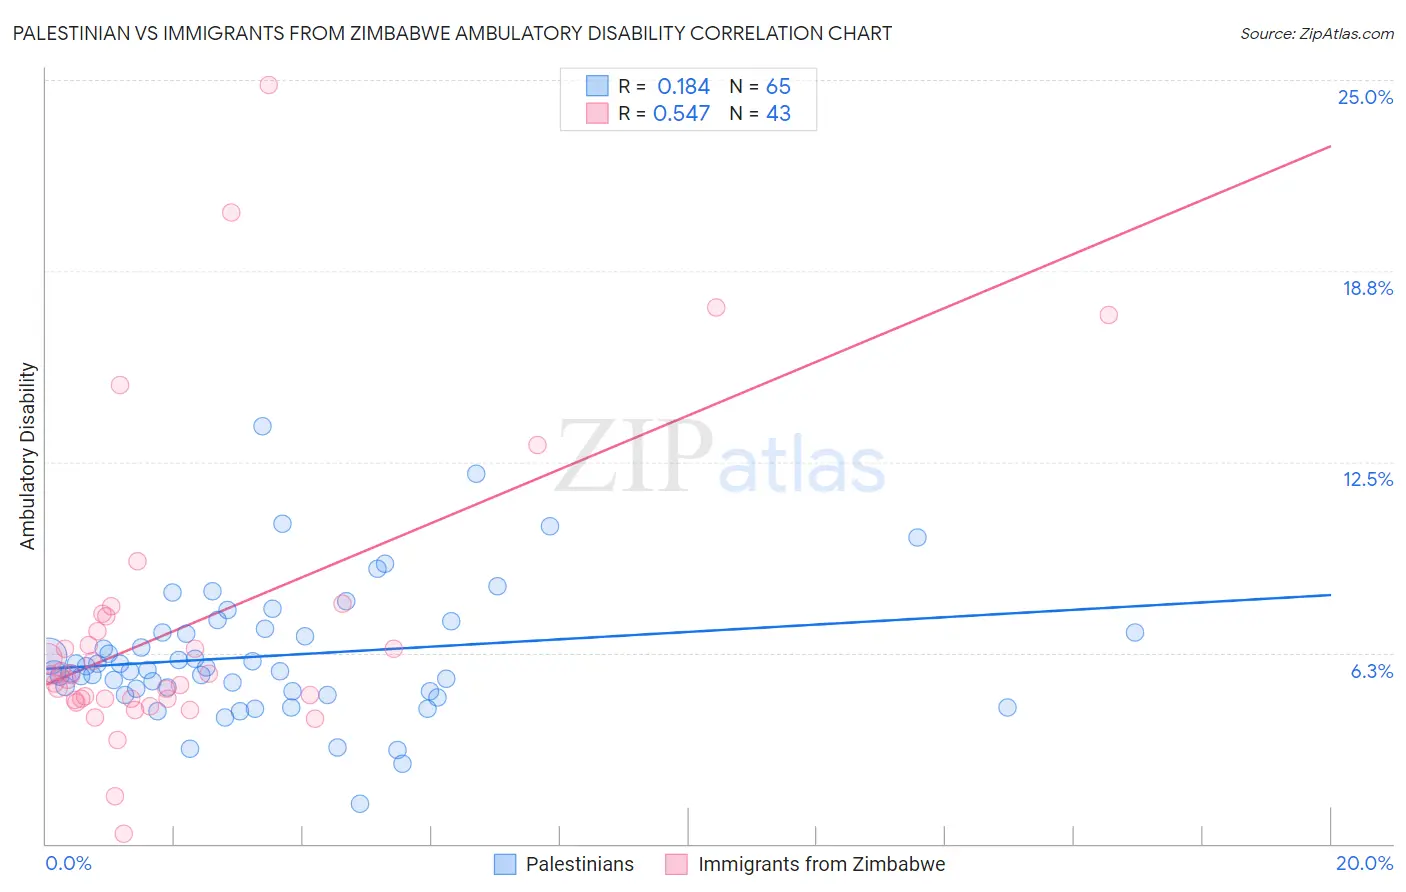
Palestinian vs Immigrants from Zimbabwe Ambulatory Disability Correlation Chart
The statistical analysis conducted on geographies consisting of 216,450,834 people shows a poor positive correlation between the proportion of Palestinians and percentage of population with ambulatory disability in the United States with a correlation coefficient (R) of 0.184 and weighted average of 5.7%. Similarly, the statistical analysis conducted on geographies consisting of 117,792,147 people shows a substantial positive correlation between the proportion of Immigrants from Zimbabwe and percentage of population with ambulatory disability in the United States with a correlation coefficient (R) of 0.547 and weighted average of 5.6%, a difference of 1.8%.
Ambulatory Disability Correlation Summary
| Measurement | Palestinian | Immigrants from Zimbabwe |
| Minimum | 1.3% | 0.34% |
| Maximum | 13.7% | 24.9% |
| Range | 12.3% | 24.5% |
| Mean | 6.2% | 7.1% |
| Median | 5.7% | 5.5% |
| Interquartile 25% (IQ1) | 5.0% | 4.7% |
| Interquartile 75% (IQ3) | 7.0% | 7.5% |
| Interquartile Range (IQR) | 2.0% | 2.7% |
| Standard Deviation (Sample) | 2.1% | 4.9% |
| Standard Deviation (Population) | 2.1% | 4.9% |
Similar Demographics by Ambulatory Disability
Demographics Similar to Palestinians by Ambulatory Disability
In terms of ambulatory disability, the demographic groups most similar to Palestinians are Immigrants from Jordan (5.7%, a difference of 0.0%), Immigrants from Ireland (5.7%, a difference of 0.010%), Eastern European (5.7%, a difference of 0.020%), Ugandan (5.7%, a difference of 0.020%), and Chilean (5.7%, a difference of 0.14%).
| Demographics | Rating | Rank | Ambulatory Disability |
| Immigrants | South Africa | 99.3 /100 | #75 | Exceptional 5.7% |
| Sudanese | 99.3 /100 | #76 | Exceptional 5.7% |
| Immigrants | Vietnam | 99.3 /100 | #77 | Exceptional 5.7% |
| Somalis | 99.2 /100 | #78 | Exceptional 5.7% |
| Chileans | 99.2 /100 | #79 | Exceptional 5.7% |
| Immigrants | Ireland | 99.2 /100 | #80 | Exceptional 5.7% |
| Immigrants | Jordan | 99.2 /100 | #81 | Exceptional 5.7% |
| Palestinians | 99.2 /100 | #82 | Exceptional 5.7% |
| Eastern Europeans | 99.2 /100 | #83 | Exceptional 5.7% |
| Ugandans | 99.2 /100 | #84 | Exceptional 5.7% |
| South Americans | 99.0 /100 | #85 | Exceptional 5.7% |
| Latvians | 99.0 /100 | #86 | Exceptional 5.7% |
| Immigrants | Chile | 98.9 /100 | #87 | Exceptional 5.8% |
| Soviet Union | 98.9 /100 | #88 | Exceptional 5.8% |
| Bhutanese | 98.8 /100 | #89 | Exceptional 5.8% |
Demographics Similar to Immigrants from Zimbabwe by Ambulatory Disability
In terms of ambulatory disability, the demographic groups most similar to Immigrants from Zimbabwe are Immigrants from Afghanistan (5.6%, a difference of 0.040%), Immigrants from Brazil (5.6%, a difference of 0.060%), Immigrants from Lithuania (5.6%, a difference of 0.080%), Immigrants from Belgium (5.6%, a difference of 0.20%), and Immigrants from Spain (5.6%, a difference of 0.21%).
| Demographics | Rating | Rank | Ambulatory Disability |
| Taiwanese | 99.8 /100 | #51 | Exceptional 5.6% |
| Jordanians | 99.8 /100 | #52 | Exceptional 5.6% |
| Immigrants | Egypt | 99.8 /100 | #53 | Exceptional 5.6% |
| Immigrants | Eastern Africa | 99.8 /100 | #54 | Exceptional 5.6% |
| Immigrants | Bulgaria | 99.8 /100 | #55 | Exceptional 5.6% |
| Inupiat | 99.8 /100 | #56 | Exceptional 5.6% |
| Immigrants | Brazil | 99.8 /100 | #57 | Exceptional 5.6% |
| Immigrants | Zimbabwe | 99.8 /100 | #58 | Exceptional 5.6% |
| Immigrants | Afghanistan | 99.8 /100 | #59 | Exceptional 5.6% |
| Immigrants | Lithuania | 99.8 /100 | #60 | Exceptional 5.6% |
| Immigrants | Belgium | 99.7 /100 | #61 | Exceptional 5.6% |
| Immigrants | Spain | 99.7 /100 | #62 | Exceptional 5.6% |
| Immigrants | France | 99.7 /100 | #63 | Exceptional 5.6% |
| Laotians | 99.7 /100 | #64 | Exceptional 5.7% |
| Immigrants | Switzerland | 99.7 /100 | #65 | Exceptional 5.7% |