Immigrants from Jordan vs Immigrants from Zimbabwe Ambulatory Disability
COMPARE
Immigrants from Jordan
Immigrants from Zimbabwe
Ambulatory Disability
Ambulatory Disability Comparison
Immigrants from Jordan
Immigrants from Zimbabwe
5.7%
AMBULATORY DISABILITY
99.2/ 100
METRIC RATING
81st/ 347
METRIC RANK
5.6%
AMBULATORY DISABILITY
99.8/ 100
METRIC RATING
58th/ 347
METRIC RANK
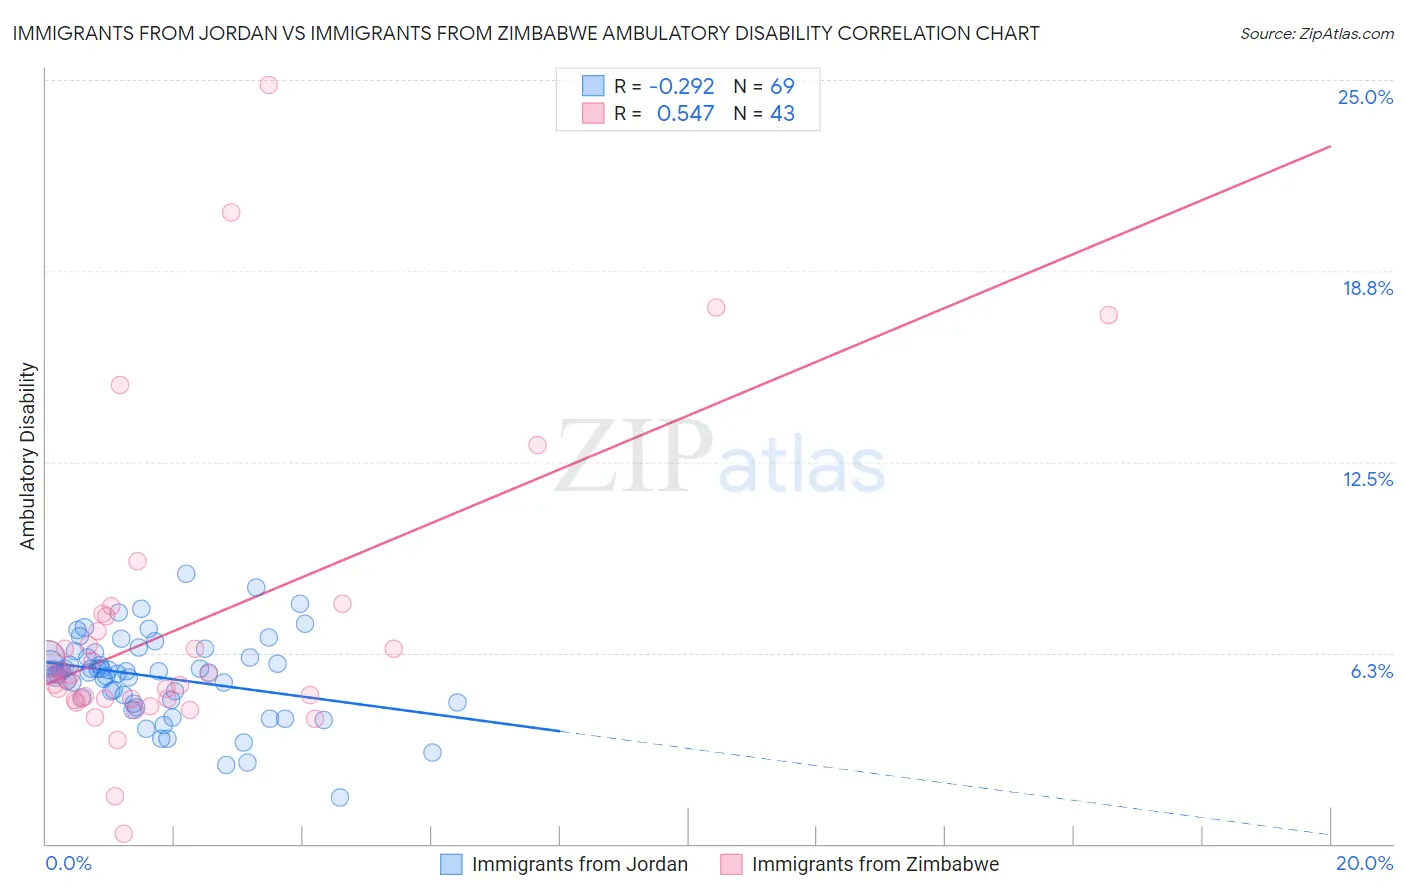
Immigrants from Jordan vs Immigrants from Zimbabwe Ambulatory Disability Correlation Chart
The statistical analysis conducted on geographies consisting of 181,269,756 people shows a weak negative correlation between the proportion of Immigrants from Jordan and percentage of population with ambulatory disability in the United States with a correlation coefficient (R) of -0.292 and weighted average of 5.7%. Similarly, the statistical analysis conducted on geographies consisting of 117,792,147 people shows a substantial positive correlation between the proportion of Immigrants from Zimbabwe and percentage of population with ambulatory disability in the United States with a correlation coefficient (R) of 0.547 and weighted average of 5.6%, a difference of 1.8%.
Ambulatory Disability Correlation Summary
| Measurement | Immigrants from Jordan | Immigrants from Zimbabwe |
| Minimum | 1.5% | 0.34% |
| Maximum | 8.9% | 24.9% |
| Range | 7.3% | 24.5% |
| Mean | 5.5% | 7.1% |
| Median | 5.6% | 5.5% |
| Interquartile 25% (IQ1) | 4.7% | 4.7% |
| Interquartile 75% (IQ3) | 6.2% | 7.5% |
| Interquartile Range (IQR) | 1.5% | 2.7% |
| Standard Deviation (Sample) | 1.4% | 4.9% |
| Standard Deviation (Population) | 1.4% | 4.9% |
Similar Demographics by Ambulatory Disability
Demographics Similar to Immigrants from Jordan by Ambulatory Disability
In terms of ambulatory disability, the demographic groups most similar to Immigrants from Jordan are Palestinian (5.7%, a difference of 0.0%), Immigrants from Ireland (5.7%, a difference of 0.010%), Eastern European (5.7%, a difference of 0.020%), Ugandan (5.7%, a difference of 0.030%), and Somali (5.7%, a difference of 0.14%).
| Demographics | Rating | Rank | Ambulatory Disability |
| Immigrants | Cameroon | 99.4 /100 | #74 | Exceptional 5.7% |
| Immigrants | South Africa | 99.3 /100 | #75 | Exceptional 5.7% |
| Sudanese | 99.3 /100 | #76 | Exceptional 5.7% |
| Immigrants | Vietnam | 99.3 /100 | #77 | Exceptional 5.7% |
| Somalis | 99.2 /100 | #78 | Exceptional 5.7% |
| Chileans | 99.2 /100 | #79 | Exceptional 5.7% |
| Immigrants | Ireland | 99.2 /100 | #80 | Exceptional 5.7% |
| Immigrants | Jordan | 99.2 /100 | #81 | Exceptional 5.7% |
| Palestinians | 99.2 /100 | #82 | Exceptional 5.7% |
| Eastern Europeans | 99.2 /100 | #83 | Exceptional 5.7% |
| Ugandans | 99.2 /100 | #84 | Exceptional 5.7% |
| South Americans | 99.0 /100 | #85 | Exceptional 5.7% |
| Latvians | 99.0 /100 | #86 | Exceptional 5.7% |
| Immigrants | Chile | 98.9 /100 | #87 | Exceptional 5.8% |
| Soviet Union | 98.9 /100 | #88 | Exceptional 5.8% |
Demographics Similar to Immigrants from Zimbabwe by Ambulatory Disability
In terms of ambulatory disability, the demographic groups most similar to Immigrants from Zimbabwe are Immigrants from Afghanistan (5.6%, a difference of 0.040%), Immigrants from Brazil (5.6%, a difference of 0.060%), Immigrants from Lithuania (5.6%, a difference of 0.080%), Immigrants from Belgium (5.6%, a difference of 0.20%), and Immigrants from Spain (5.6%, a difference of 0.21%).
| Demographics | Rating | Rank | Ambulatory Disability |
| Taiwanese | 99.8 /100 | #51 | Exceptional 5.6% |
| Jordanians | 99.8 /100 | #52 | Exceptional 5.6% |
| Immigrants | Egypt | 99.8 /100 | #53 | Exceptional 5.6% |
| Immigrants | Eastern Africa | 99.8 /100 | #54 | Exceptional 5.6% |
| Immigrants | Bulgaria | 99.8 /100 | #55 | Exceptional 5.6% |
| Inupiat | 99.8 /100 | #56 | Exceptional 5.6% |
| Immigrants | Brazil | 99.8 /100 | #57 | Exceptional 5.6% |
| Immigrants | Zimbabwe | 99.8 /100 | #58 | Exceptional 5.6% |
| Immigrants | Afghanistan | 99.8 /100 | #59 | Exceptional 5.6% |
| Immigrants | Lithuania | 99.8 /100 | #60 | Exceptional 5.6% |
| Immigrants | Belgium | 99.7 /100 | #61 | Exceptional 5.6% |
| Immigrants | Spain | 99.7 /100 | #62 | Exceptional 5.6% |
| Immigrants | France | 99.7 /100 | #63 | Exceptional 5.6% |
| Laotians | 99.7 /100 | #64 | Exceptional 5.7% |
| Immigrants | Switzerland | 99.7 /100 | #65 | Exceptional 5.7% |