Nigerian vs Immigrants from South Central Asia In Labor Force | Age 45-54

COMPARE

Nigerian
Race
Ancestry
AfghanAfricanAlaska NativeAlaskan AthabascanAlbanianAleutAlsatianAmericanApacheArabArapahoArgentineanArmenianAssyrian/Chaldean/SyriacAustralianAustrianBahamianBangladeshiBarbadianBasqueBelgianBelizeanBermudanBhutaneseBlackfeetBolivianBrazilianBritishBritish West IndianBulgarianBurmeseCajunCambodianCanadianCape VerdeanCarpatho RusynCelticCentral AmericanCentral American IndianCherokeeCheyenneChickasawChileanChineseChippewaChoctawColombianColvilleComancheCosta RicanCreeCreekCroatianCrowCubanCypriotCzechCzechoslovakianDanishDelawareDominicanDutchDutch West IndianEastern EuropeanEcuadorianEgyptianEnglishEstonianEthiopianEuropeanFijianFilipinoFinnishFrenchFrench American IndianFrench CanadianGermanGerman RussianGhanaianGreekGuamanian/ChamorroGuatemalanGuyaneseHaitianHmongHonduranHopiHoumaHungarianIcelanderIndian (Asian)IndonesianInupiatIranianIraqiIrishIroquoisIsraeliItalianJamaicanJapaneseJordanianKenyanKiowaKoreanLaotianLatvianLebaneseLiberianLithuanianLumbeeLuxembourgerMacedonianMalaysianMalteseMarshalleseMenomineeMexicanMexican American IndianMongolianMoroccanNative HawaiianNavajoNepaleseNew ZealanderNicaraguanNigerianNorthern EuropeanNorwegianOkinawanOsageOttawaPaiutePakistaniPalestinianPanamanianParaguayanPennsylvania GermanPeruvianPimaPolishPortuguesePotawatomiPuebloPuerto RicanPuget Sound SalishRomanianRussianSalvadoranSamoanScandinavianScotch-IrishScottishSeminoleSenegaleseSerbianShoshoneSierra LeoneanSiouxSlavicSlovakSloveneSomaliSouth AfricanSouth AmericanSouth American IndianSoviet UnionSpaniardSpanishSpanish AmericanSpanish American IndianSri LankanSubsaharan AfricanSudaneseSwedishSwissSyrianTaiwaneseThaiTlingit-HaidaTohono O'OdhamTonganTrinidadian and TobagonianTsimshianTurkishU.S. Virgin IslanderUgandanUkrainianUruguayanUteVenezuelanVietnameseWelshWest IndianYakamaYaquiYugoslavianYumanYup'ikZimbabwean
Immigration
NonimmigrantsImmigrantsAfghanistanAfricaAlbaniaArgentinaArmeniaAsiaAustraliaAustriaBahamasBangladeshBarbadosBelarusBelgiumBelizeBoliviaBosnia and HerzegovinaBrazilBulgariaBurma/MyanmarCabo VerdeCambodiaCameroonCanadaCaribbeanCentral AmericaChileChinaColombiaCongoCosta RicaCroatiaCubaCzechoslovakiaDenmarkDominicaDominican RepublicEastern AfricaEastern AsiaEastern EuropeEcuadorEgyptEl SalvadorEnglandEritreaEthiopiaEuropeFijiFranceGermanyGhanaGreeceGrenadaGuatemalaGuyanaHaitiHondurasHong KongHungaryIndiaIndonesiaIranIraqIrelandIsraelItalyJamaicaJapanJordanKazakhstanKenyaKoreaKuwaitLaosLatin AmericaLatviaLebanonLiberiaLithuaniaMalaysiaMexicoMicronesiaMiddle AfricaMoldovaMoroccoNepalNetherlandsNicaraguaNigeriaNorth AmericaNorth MacedoniaNorthern AfricaNorthern EuropeNorwayOceaniaPakistanPanamaPeruPhilippinesPolandPortugalRomaniaRussiaSaudi ArabiaScotlandSenegalSerbiaSierra LeoneSingaporeSomaliaSouth AfricaSouth AmericaSouth Eastern AsiaSouthern EuropeSpainSri LankaSt. Vincent and the GrenadinesSudanSwedenSwitzerlandSyriaTaiwanThailandTrinidad and TobagoTurkeyUgandaUkraineUruguayUzbekistanVenezuelaVietnamWest IndiesWestern AfricaWestern AsiaWestern EuropeYemenZaireZimbabweAzores
Immigrants from South Central Asia
Race
Ancestry
AfghanAfricanAlaska NativeAlaskan AthabascanAlbanianAleutAlsatianAmericanApacheArabArapahoArgentineanArmenianAssyrian/Chaldean/SyriacAustralianAustrianBahamianBangladeshiBarbadianBasqueBelgianBelizeanBermudanBhutaneseBlackfeetBolivianBrazilianBritishBritish West IndianBulgarianBurmeseCajunCambodianCanadianCape VerdeanCarpatho RusynCelticCentral AmericanCentral American IndianCherokeeCheyenneChickasawChileanChineseChippewaChoctawColombianColvilleComancheCosta RicanCreeCreekCroatianCrowCubanCypriotCzechCzechoslovakianDanishDelawareDominicanDutchDutch West IndianEastern EuropeanEcuadorianEgyptianEnglishEstonianEthiopianEuropeanFijianFilipinoFinnishFrenchFrench American IndianFrench CanadianGermanGerman RussianGhanaianGreekGuamanian/ChamorroGuatemalanGuyaneseHaitianHmongHonduranHopiHoumaHungarianIcelanderIndian (Asian)IndonesianInupiatIranianIraqiIrishIroquoisIsraeliItalianJamaicanJapaneseJordanianKenyanKiowaKoreanLaotianLatvianLebaneseLiberianLithuanianLumbeeLuxembourgerMacedonianMalaysianMalteseMarshalleseMenomineeMexicanMexican American IndianMongolianMoroccanNative HawaiianNavajoNepaleseNew ZealanderNicaraguanNorthern EuropeanNorwegianOkinawanOsageOttawaPaiutePakistaniPalestinianPanamanianParaguayanPennsylvania GermanPeruvianPimaPolishPortuguesePotawatomiPuebloPuerto RicanPuget Sound SalishRomanianRussianSalvadoranSamoanScandinavianScotch-IrishScottishSeminoleSenegaleseSerbianShoshoneSierra LeoneanSiouxSlavicSlovakSloveneSomaliSouth AfricanSouth AmericanSouth American IndianSoviet UnionSpaniardSpanishSpanish AmericanSpanish American IndianSri LankanSubsaharan AfricanSudaneseSwedishSwissSyrianTaiwaneseThaiTlingit-HaidaTohono O'OdhamTonganTrinidadian and TobagonianTsimshianTurkishU.S. Virgin IslanderUgandanUkrainianUruguayanUteVenezuelanVietnameseWelshWest IndianYakamaYaquiYugoslavianYumanYup'ikZimbabwean
Immigration
NonimmigrantsImmigrantsAfghanistanAfricaAlbaniaArgentinaArmeniaAsiaAustraliaAustriaBahamasBangladeshBarbadosBelarusBelgiumBelizeBoliviaBosnia and HerzegovinaBrazilBulgariaBurma/MyanmarCabo VerdeCambodiaCameroonCanadaCaribbeanCentral AmericaChileChinaColombiaCongoCosta RicaCroatiaCubaCzechoslovakiaDenmarkDominicaDominican RepublicEastern AfricaEastern AsiaEastern EuropeEcuadorEgyptEl SalvadorEnglandEritreaEthiopiaEuropeFijiFranceGermanyGhanaGreeceGrenadaGuatemalaGuyanaHaitiHondurasHong KongHungaryIndiaIndonesiaIranIraqIrelandIsraelItalyJamaicaJapanJordanKazakhstanKenyaKoreaKuwaitLaosLatin AmericaLatviaLebanonLiberiaLithuaniaMalaysiaMexicoMicronesiaMiddle AfricaMoldovaMoroccoNepalNetherlandsNicaraguaNigeriaNorth AmericaNorth MacedoniaNorthern AfricaNorthern EuropeNorwayOceaniaPakistanPanamaPeruPhilippinesPolandPortugalRomaniaRussiaSaudi ArabiaScotlandSenegalSerbiaSierra LeoneSingaporeSomaliaSouth AfricaSouth AmericaSouth Central AsiaSouth Eastern AsiaSouthern EuropeSpainSri LankaSt. Vincent and the GrenadinesSudanSwedenSwitzerlandSyriaTaiwanThailandTrinidad and TobagoTurkeyUgandaUkraineUruguayUzbekistanVenezuelaVietnamWest IndiesWestern AfricaWestern AsiaWestern EuropeYemenZaireZimbabweAzores
In Labor Force | Age 45-54
Income
Poverty
Unemployment
Labor Participation
Family Structure
Vehicle Availability
Education Level
Disability

In Labor Force | Age 45-54 Comparison

Nigerians

Immigrants from South Central Asia

Average
Exceptional
82.7%
IN LABOR FORCE | AGE 45-54
40.5/ 100
METRIC RATING
178th/ 347
METRIC RANK
84.0%
IN LABOR FORCE | AGE 45-54
99.9/ 100
METRIC RATING
18th/ 347
METRIC RANK

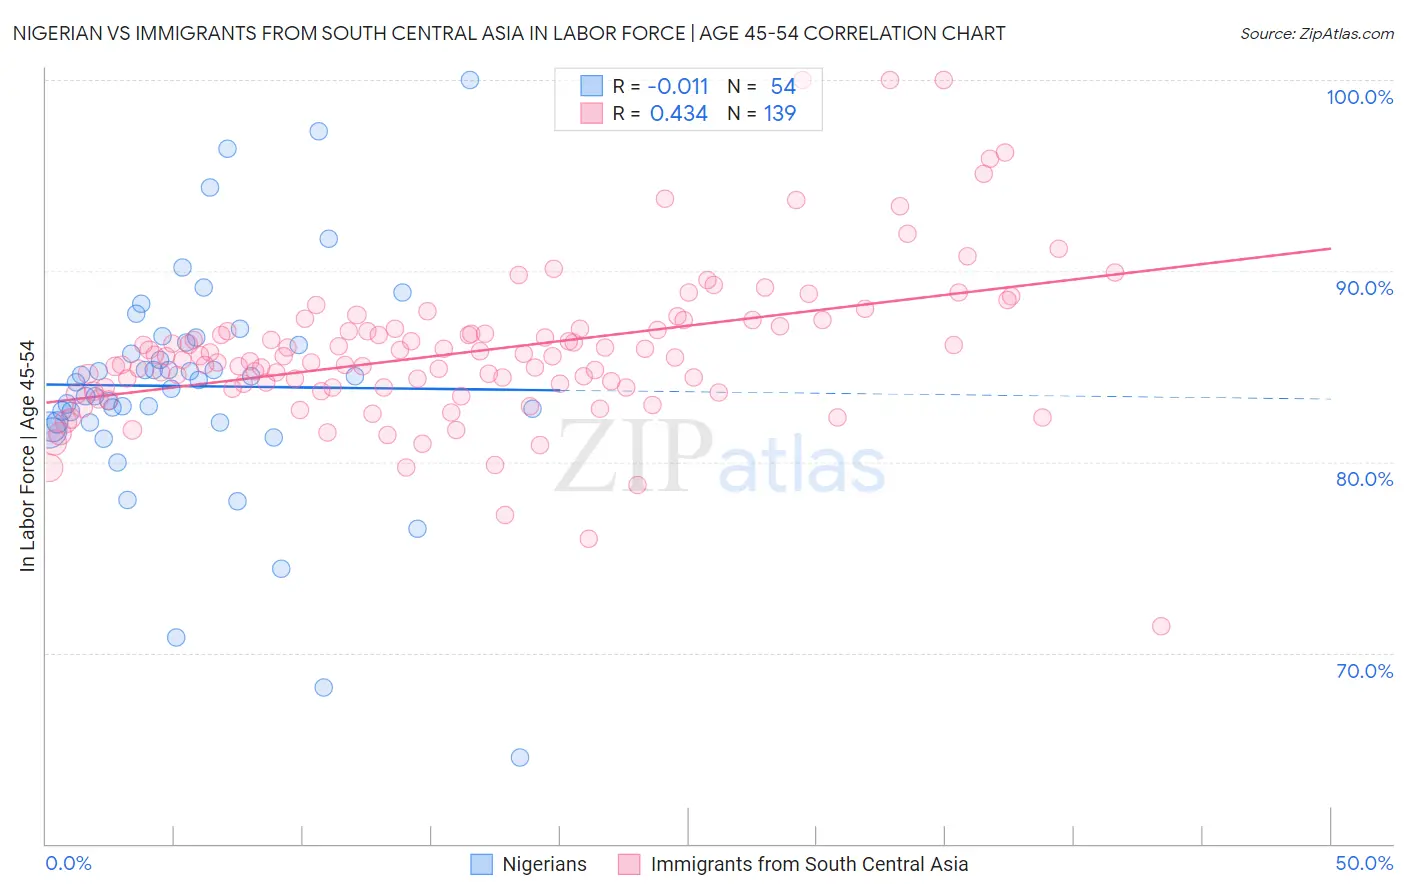
Nigerian vs Immigrants from South Central Asia In Labor Force | Age 45-54 Correlation Chart

The statistical analysis conducted on geographies consisting of 332,454,323 people shows no correlation between the proportion of Nigerians and labor force participation rate among population between the ages 45 and 54 in the United States with a correlation coefficient (R) of -0.011 and weighted average of 82.7%. Similarly, the statistical analysis conducted on geographies consisting of 472,630,186 people shows a moderate positive correlation between the proportion of Immigrants from South Central Asia and labor force participation rate among population between the ages 45 and 54 in the United States with a correlation coefficient (R) of 0.434 and weighted average of 84.0%, a difference of 1.6%.
Nigerian vs Immigrants from South Central Asia In Labor Force | Age 45-54

In Labor Force | Age 45-54 Correlation Summary

MeasurementNigerianImmigrants from South Central Asia
Minimum64.5%71.4%
Maximum100.0%100.0%
Range35.5%28.6%
Mean84.0%85.8%
Median84.2%85.5%
Interquartile 25% (IQ1)82.1%83.9%
Interquartile 75% (IQ3)86.2%87.0%
Interquartile Range (IQR)4.2%3.1%
Standard Deviation (Sample)6.2%4.1%
Standard Deviation (Population)6.1%4.0%

Similar Demographics by In Labor Force | Age 45-54

Demographics Similar to Nigerians by In Labor Force | Age 45-54

In terms of in labor force | age 45-54, the demographic groups most similar to Nigerians are Immigrants from Switzerland (82.7%, a difference of 0.010%), Hungarian (82.7%, a difference of 0.020%), Israeli (82.7%, a difference of 0.030%), Immigrants from Hungary (82.7%, a difference of 0.030%), and Immigrants from Nicaragua (82.7%, a difference of 0.040%).
DemographicsRating | RankIn Labor Force | Age 45-54
Immigrants | Zaire
52.9
/100
|
#171
Average
82.8%
Icelanders
51.8
/100
|
#172
Average
82.8%
Nicaraguans
50.3
/100
|
#173
Average
82.8%
Costa Ricans
50.0
/100
|
#174
Average
82.8%
Immigrants | Liberia
47.9
/100
|
#175
Average
82.7%
Northern Europeans
46.9
/100
|
#176
Average
82.7%
Immigrants | Nicaragua
44.6
/100
|
#177
Average
82.7%
Nigerians
40.5
/100
|
#178
Average
82.7%
Immigrants | Switzerland
39.4
/100
|
#179
Fair
82.7%
Hungarians
38.0
/100
|
#180
Fair
82.7%
Israelis
37.7
/100
|
#181
Fair
82.7%
Immigrants | Hungary
37.1
/100
|
#182
Fair
82.7%
New Zealanders
32.7
/100
|
#183
Fair
82.6%
Europeans
32.6
/100
|
#184
Fair
82.6%
Immigrants | England
32.2
/100
|
#185
Fair
82.6%

Demographics Similar to Immigrants from South Central Asia by In Labor Force | Age 45-54

In terms of in labor force | age 45-54, the demographic groups most similar to Immigrants from South Central Asia are Zimbabwean (84.0%, a difference of 0.0%), Immigrants from Nepal (84.0%, a difference of 0.030%), Cypriot (84.1%, a difference of 0.040%), Cambodian (84.1%, a difference of 0.10%), and Czech (83.9%, a difference of 0.11%).
DemographicsRating | RankIn Labor Force | Age 45-54
Thais
100.0
/100
|
#11
Exceptional
84.3%
Bulgarians
100.0
/100
|
#12
Exceptional
84.2%
Chinese
99.9
/100
|
#13
Exceptional
84.1%
Cambodians
99.9
/100
|
#14
Exceptional
84.1%
Cypriots
99.9
/100
|
#15
Exceptional
84.1%
Immigrants | Nepal
99.9
/100
|
#16
Exceptional
84.0%
Zimbabweans
99.9
/100
|
#17
Exceptional
84.0%
Immigrants | South Central Asia
99.9
/100
|
#18
Exceptional
84.0%
Czechs
99.8
/100
|
#19
Exceptional
83.9%
Immigrants | Eastern Africa
99.8
/100
|
#20
Exceptional
83.9%
Immigrants | Sri Lanka
99.8
/100
|
#21
Exceptional
83.9%
Immigrants | Ireland
99.8
/100
|
#22
Exceptional
83.9%
Tlingit-Haida
99.8
/100
|
#23
Exceptional
83.9%
Slovenes
99.8
/100
|
#24
Exceptional
83.9%
Immigrants | North Macedonia
99.8
/100
|
#25
Exceptional
83.9%