Hawaiian vs Immigrants from South Central Asia Cognitive Disability
COMPARE
Hawaiian
Immigrants from South Central Asia
Cognitive Disability
Cognitive Disability Comparison
Hawaiians
Immigrants from South Central Asia
17.6%
COGNITIVE DISABILITY
7.2/ 100
METRIC RATING
213th/ 347
METRIC RANK
16.4%
COGNITIVE DISABILITY
99.9/ 100
METRIC RATING
22nd/ 347
METRIC RANK
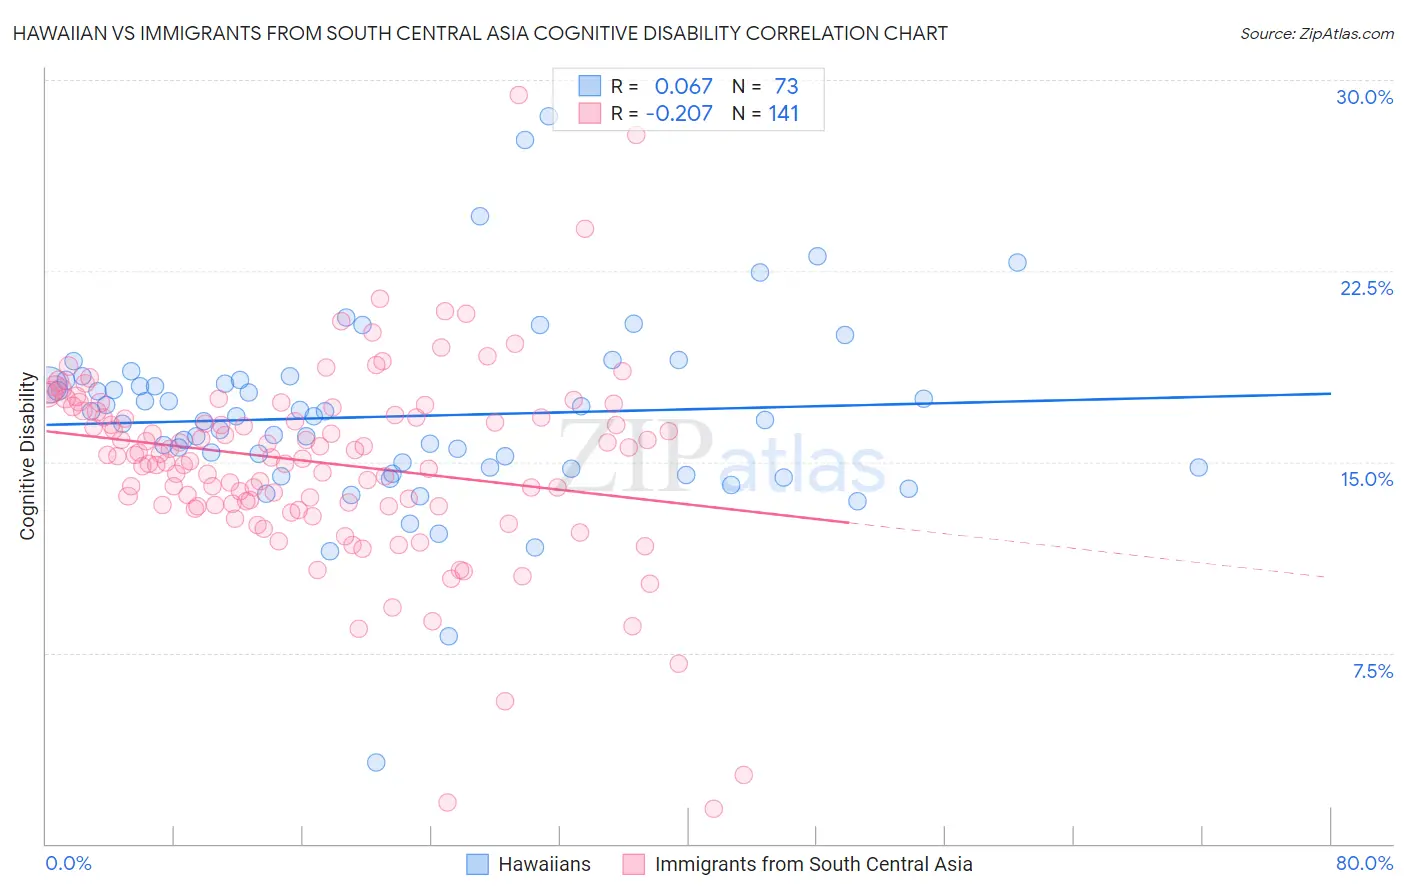
Hawaiian vs Immigrants from South Central Asia Cognitive Disability Correlation Chart
The statistical analysis conducted on geographies consisting of 327,505,207 people shows a slight positive correlation between the proportion of Hawaiians and percentage of population with cognitive disability in the United States with a correlation coefficient (R) of 0.067 and weighted average of 17.6%. Similarly, the statistical analysis conducted on geographies consisting of 473,055,858 people shows a weak negative correlation between the proportion of Immigrants from South Central Asia and percentage of population with cognitive disability in the United States with a correlation coefficient (R) of -0.207 and weighted average of 16.4%, a difference of 7.5%.
Cognitive Disability Correlation Summary
| Measurement | Hawaiian | Immigrants from South Central Asia |
| Minimum | 3.2% | 1.4% |
| Maximum | 28.6% | 29.4% |
| Range | 25.4% | 28.0% |
| Mean | 16.8% | 15.0% |
| Median | 16.8% | 15.3% |
| Interquartile 25% (IQ1) | 14.7% | 13.3% |
| Interquartile 75% (IQ3) | 18.2% | 17.0% |
| Interquartile Range (IQR) | 3.5% | 3.7% |
| Standard Deviation (Sample) | 3.7% | 3.8% |
| Standard Deviation (Population) | 3.7% | 3.8% |
Similar Demographics by Cognitive Disability
Demographics Similar to Hawaiians by Cognitive Disability
In terms of cognitive disability, the demographic groups most similar to Hawaiians are Immigrants from Oceania (17.6%, a difference of 0.010%), Immigrants from El Salvador (17.6%, a difference of 0.020%), Alaskan Athabascan (17.6%, a difference of 0.030%), Okinawan (17.6%, a difference of 0.040%), and Taiwanese (17.6%, a difference of 0.050%).
| Demographics | Rating | Rank | Cognitive Disability |
| Alaska Natives | 10.4 /100 | #206 | Poor 17.5% |
| Immigrants | Latin America | 9.7 /100 | #207 | Tragic 17.6% |
| Immigrants | Cameroon | 9.3 /100 | #208 | Tragic 17.6% |
| Immigrants | Trinidad and Tobago | 8.7 /100 | #209 | Tragic 17.6% |
| Immigrants | Jamaica | 8.5 /100 | #210 | Tragic 17.6% |
| Taiwanese | 7.7 /100 | #211 | Tragic 17.6% |
| Immigrants | Oceania | 7.3 /100 | #212 | Tragic 17.6% |
| Hawaiians | 7.2 /100 | #213 | Tragic 17.6% |
| Immigrants | El Salvador | 7.0 /100 | #214 | Tragic 17.6% |
| Alaskan Athabascans | 6.9 /100 | #215 | Tragic 17.6% |
| Okinawans | 6.8 /100 | #216 | Tragic 17.6% |
| Salvadorans | 6.7 /100 | #217 | Tragic 17.6% |
| Icelanders | 6.4 /100 | #218 | Tragic 17.6% |
| Immigrants | Sierra Leone | 6.3 /100 | #219 | Tragic 17.6% |
| Zimbabweans | 6.1 /100 | #220 | Tragic 17.6% |
Demographics Similar to Immigrants from South Central Asia by Cognitive Disability
In terms of cognitive disability, the demographic groups most similar to Immigrants from South Central Asia are Croatian (16.4%, a difference of 0.030%), Immigrants from Argentina (16.4%, a difference of 0.060%), Luxembourger (16.4%, a difference of 0.10%), Immigrants from Cuba (16.3%, a difference of 0.13%), and Immigrants from Croatia (16.4%, a difference of 0.13%).
| Demographics | Rating | Rank | Cognitive Disability |
| Immigrants | Greece | 100.0 /100 | #15 | Exceptional 16.3% |
| Eastern Europeans | 100.0 /100 | #16 | Exceptional 16.3% |
| Immigrants | North Macedonia | 100.0 /100 | #17 | Exceptional 16.3% |
| Immigrants | Northern Europe | 100.0 /100 | #18 | Exceptional 16.3% |
| Immigrants | Bolivia | 100.0 /100 | #19 | Exceptional 16.3% |
| Bulgarians | 100.0 /100 | #20 | Exceptional 16.3% |
| Immigrants | Cuba | 100.0 /100 | #21 | Exceptional 16.3% |
| Immigrants | South Central Asia | 99.9 /100 | #22 | Exceptional 16.4% |
| Croatians | 99.9 /100 | #23 | Exceptional 16.4% |
| Immigrants | Argentina | 99.9 /100 | #24 | Exceptional 16.4% |
| Luxembourgers | 99.9 /100 | #25 | Exceptional 16.4% |
| Immigrants | Croatia | 99.9 /100 | #26 | Exceptional 16.4% |
| Immigrants | Pakistan | 99.9 /100 | #27 | Exceptional 16.4% |
| Poles | 99.9 /100 | #28 | Exceptional 16.4% |
| Filipinos | 99.9 /100 | #29 | Exceptional 16.4% |