Nicaraguan vs South American Indian Male Disability
COMPARE
Nicaraguan
South American Indian
Male Disability
Male Disability Comparison
Nicaraguans
South American Indians
10.7%
MALE DISABILITY
96.6/ 100
METRIC RATING
96th/ 347
METRIC RANK
10.9%
MALE DISABILITY
88.1/ 100
METRIC RATING
124th/ 347
METRIC RANK
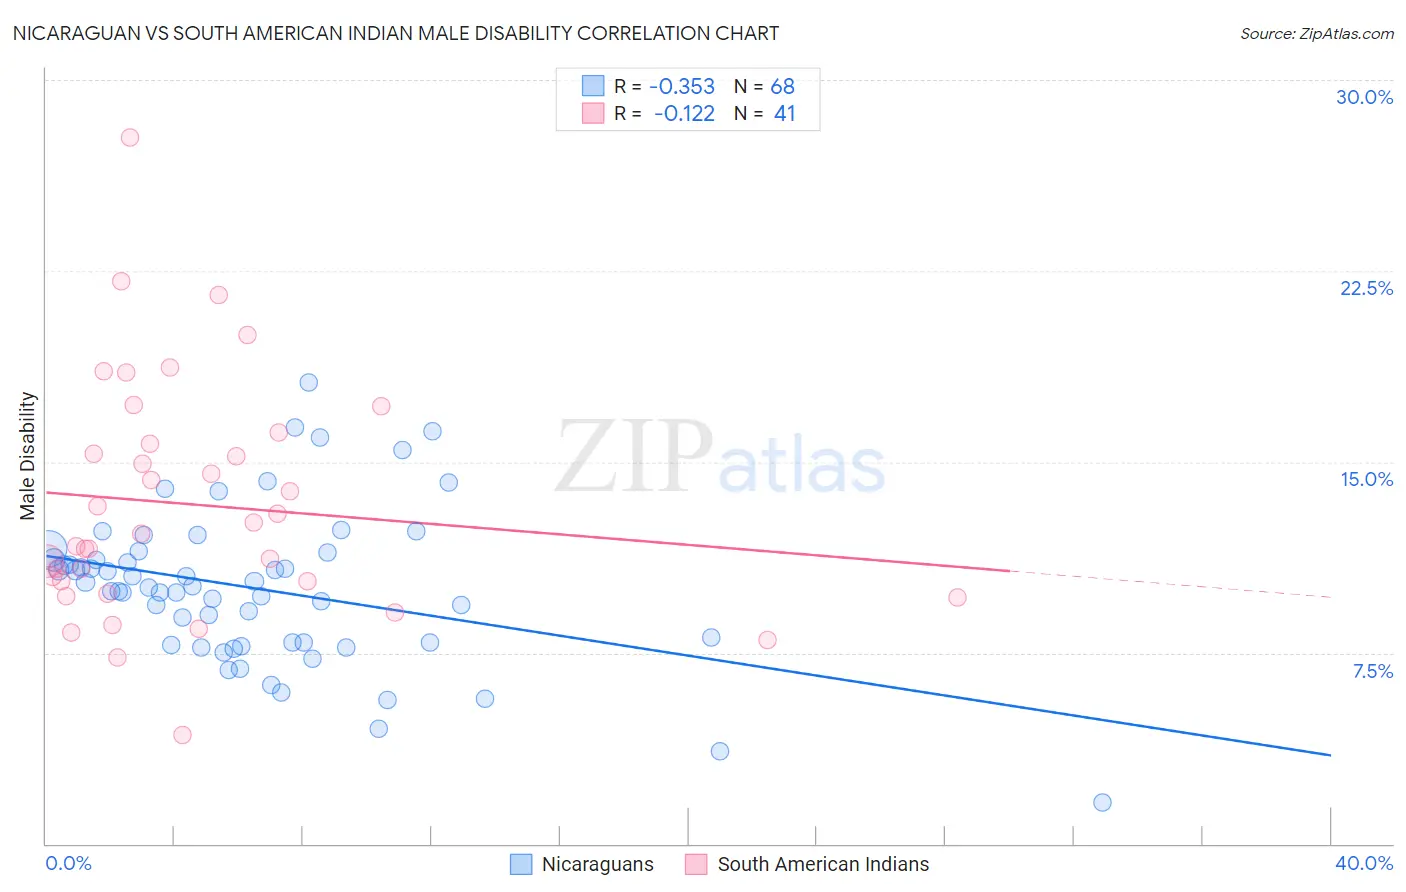
Nicaraguan vs South American Indian Male Disability Correlation Chart
The statistical analysis conducted on geographies consisting of 285,689,446 people shows a mild negative correlation between the proportion of Nicaraguans and percentage of males with a disability in the United States with a correlation coefficient (R) of -0.353 and weighted average of 10.7%. Similarly, the statistical analysis conducted on geographies consisting of 164,560,942 people shows a poor negative correlation between the proportion of South American Indians and percentage of males with a disability in the United States with a correlation coefficient (R) of -0.122 and weighted average of 10.9%, a difference of 2.0%.
Male Disability Correlation Summary
| Measurement | Nicaraguan | South American Indian |
| Minimum | 1.6% | 4.3% |
| Maximum | 18.1% | 27.7% |
| Range | 16.5% | 23.4% |
| Mean | 10.0% | 13.3% |
| Median | 10.1% | 12.2% |
| Interquartile 25% (IQ1) | 7.9% | 10.1% |
| Interquartile 75% (IQ3) | 11.3% | 15.9% |
| Interquartile Range (IQR) | 3.4% | 5.9% |
| Standard Deviation (Sample) | 3.0% | 4.7% |
| Standard Deviation (Population) | 3.0% | 4.6% |
Similar Demographics by Male Disability
Demographics Similar to Nicaraguans by Male Disability
In terms of male disability, the demographic groups most similar to Nicaraguans are Immigrants from Armenia (10.7%, a difference of 0.020%), Immigrants from Romania (10.7%, a difference of 0.080%), Chilean (10.7%, a difference of 0.10%), Immigrants from Sweden (10.7%, a difference of 0.13%), and Immigrants from Switzerland (10.7%, a difference of 0.22%).
| Demographics | Rating | Rank | Male Disability |
| Immigrants | Nicaragua | 97.8 /100 | #89 | Exceptional 10.6% |
| Immigrants | Morocco | 97.7 /100 | #90 | Exceptional 10.6% |
| Immigrants | France | 97.6 /100 | #91 | Exceptional 10.6% |
| Palestinians | 97.4 /100 | #92 | Exceptional 10.7% |
| Immigrants | St. Vincent and the Grenadines | 97.1 /100 | #93 | Exceptional 10.7% |
| Immigrants | Sweden | 96.9 /100 | #94 | Exceptional 10.7% |
| Chileans | 96.9 /100 | #95 | Exceptional 10.7% |
| Nicaraguans | 96.6 /100 | #96 | Exceptional 10.7% |
| Immigrants | Armenia | 96.6 /100 | #97 | Exceptional 10.7% |
| Immigrants | Romania | 96.5 /100 | #98 | Exceptional 10.7% |
| Immigrants | Switzerland | 96.1 /100 | #99 | Exceptional 10.7% |
| Immigrants | Kazakhstan | 95.9 /100 | #100 | Exceptional 10.7% |
| Immigrants | Greece | 95.6 /100 | #101 | Exceptional 10.7% |
| Immigrants | Eastern Europe | 95.3 /100 | #102 | Exceptional 10.7% |
| Uruguayans | 95.3 /100 | #103 | Exceptional 10.7% |
Demographics Similar to South American Indians by Male Disability
In terms of male disability, the demographic groups most similar to South American Indians are Immigrants from North Macedonia (10.9%, a difference of 0.0%), Immigrants from Czechoslovakia (10.9%, a difference of 0.040%), Immigrants from Ghana (10.9%, a difference of 0.14%), Immigrants from South Eastern Asia (10.9%, a difference of 0.15%), and Immigrants from Trinidad and Tobago (10.9%, a difference of 0.16%).
| Demographics | Rating | Rank | Male Disability |
| Eastern Europeans | 90.6 /100 | #117 | Exceptional 10.9% |
| Immigrants | Cuba | 90.2 /100 | #118 | Exceptional 10.9% |
| Armenians | 90.1 /100 | #119 | Exceptional 10.9% |
| Immigrants | Africa | 89.4 /100 | #120 | Excellent 10.9% |
| Immigrants | South Eastern Asia | 89.2 /100 | #121 | Excellent 10.9% |
| Immigrants | Ghana | 89.0 /100 | #122 | Excellent 10.9% |
| Immigrants | Czechoslovakia | 88.4 /100 | #123 | Excellent 10.9% |
| South American Indians | 88.1 /100 | #124 | Excellent 10.9% |
| Immigrants | North Macedonia | 88.1 /100 | #125 | Excellent 10.9% |
| Immigrants | Trinidad and Tobago | 86.9 /100 | #126 | Excellent 10.9% |
| Immigrants | Ukraine | 86.8 /100 | #127 | Excellent 10.9% |
| Immigrants | Latvia | 85.5 /100 | #128 | Excellent 10.9% |
| Immigrants | Philippines | 85.4 /100 | #129 | Excellent 10.9% |
| Brazilians | 85.4 /100 | #130 | Excellent 10.9% |
| Macedonians | 84.2 /100 | #131 | Excellent 11.0% |