Nicaraguan vs Black/African American Male Disability
COMPARE
Nicaraguan
Black/African American
Male Disability
Male Disability Comparison
Nicaraguans
Blacks/African Americans
10.7%
MALE DISABILITY
96.6/ 100
METRIC RATING
96th/ 347
METRIC RANK
13.2%
MALE DISABILITY
0.0/ 100
METRIC RATING
304th/ 347
METRIC RANK
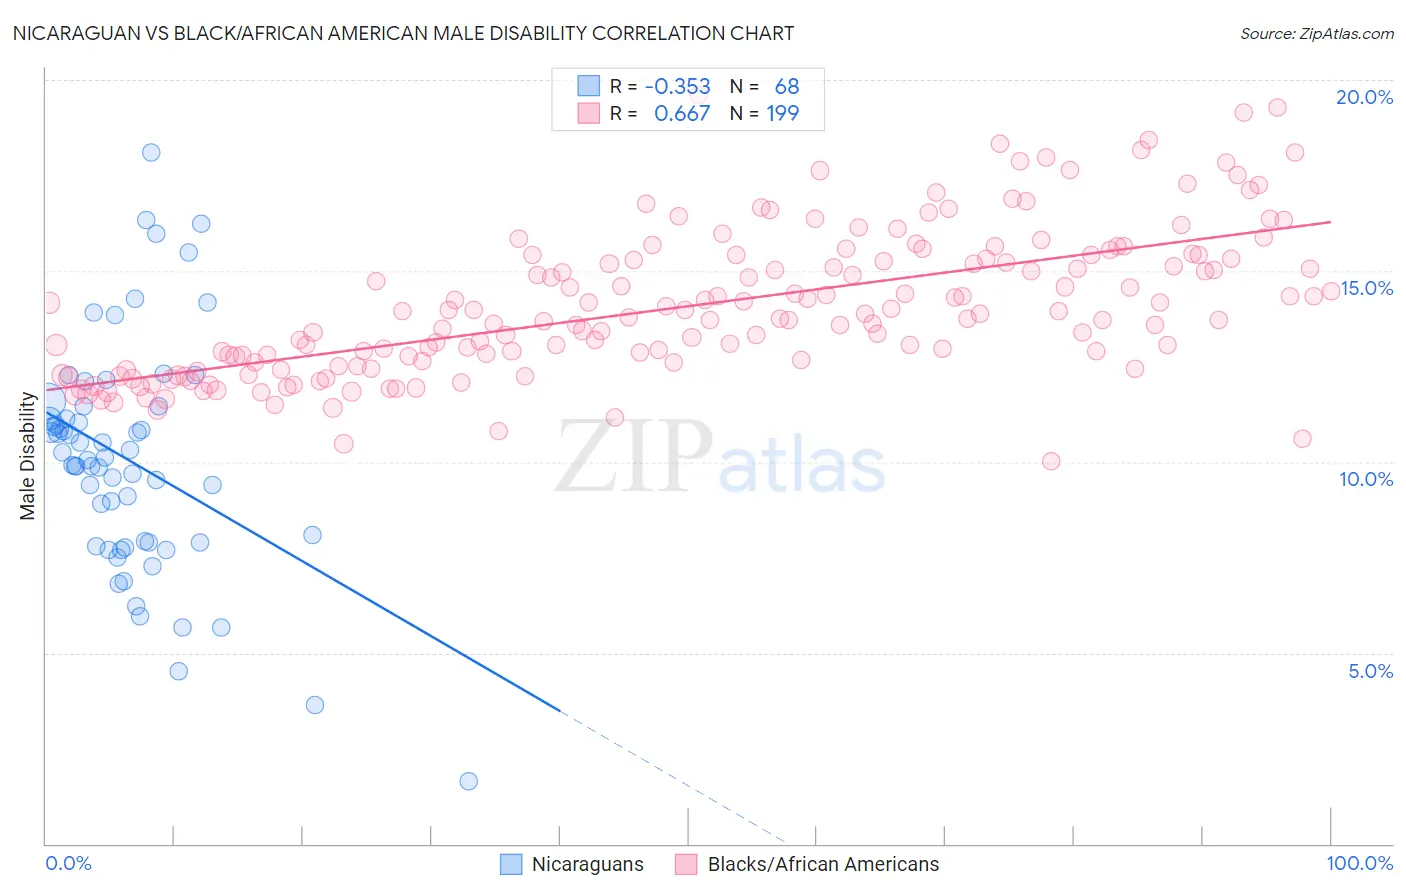
Nicaraguan vs Black/African American Male Disability Correlation Chart
The statistical analysis conducted on geographies consisting of 285,689,446 people shows a mild negative correlation between the proportion of Nicaraguans and percentage of males with a disability in the United States with a correlation coefficient (R) of -0.353 and weighted average of 10.7%. Similarly, the statistical analysis conducted on geographies consisting of 565,716,531 people shows a significant positive correlation between the proportion of Blacks/African Americans and percentage of males with a disability in the United States with a correlation coefficient (R) of 0.667 and weighted average of 13.2%, a difference of 23.7%.
Male Disability Correlation Summary
| Measurement | Nicaraguan | Black/African American |
| Minimum | 1.6% | 10.0% |
| Maximum | 18.1% | 19.6% |
| Range | 16.5% | 9.6% |
| Mean | 10.0% | 14.1% |
| Median | 10.1% | 13.7% |
| Interquartile 25% (IQ1) | 7.9% | 12.6% |
| Interquartile 75% (IQ3) | 11.3% | 15.3% |
| Interquartile Range (IQR) | 3.4% | 2.7% |
| Standard Deviation (Sample) | 3.0% | 1.9% |
| Standard Deviation (Population) | 3.0% | 1.9% |
Similar Demographics by Male Disability
Demographics Similar to Nicaraguans by Male Disability
In terms of male disability, the demographic groups most similar to Nicaraguans are Immigrants from Armenia (10.7%, a difference of 0.020%), Immigrants from Romania (10.7%, a difference of 0.080%), Chilean (10.7%, a difference of 0.10%), Immigrants from Sweden (10.7%, a difference of 0.13%), and Immigrants from Switzerland (10.7%, a difference of 0.22%).
| Demographics | Rating | Rank | Male Disability |
| Immigrants | Nicaragua | 97.8 /100 | #89 | Exceptional 10.6% |
| Immigrants | Morocco | 97.7 /100 | #90 | Exceptional 10.6% |
| Immigrants | France | 97.6 /100 | #91 | Exceptional 10.6% |
| Palestinians | 97.4 /100 | #92 | Exceptional 10.7% |
| Immigrants | St. Vincent and the Grenadines | 97.1 /100 | #93 | Exceptional 10.7% |
| Immigrants | Sweden | 96.9 /100 | #94 | Exceptional 10.7% |
| Chileans | 96.9 /100 | #95 | Exceptional 10.7% |
| Nicaraguans | 96.6 /100 | #96 | Exceptional 10.7% |
| Immigrants | Armenia | 96.6 /100 | #97 | Exceptional 10.7% |
| Immigrants | Romania | 96.5 /100 | #98 | Exceptional 10.7% |
| Immigrants | Switzerland | 96.1 /100 | #99 | Exceptional 10.7% |
| Immigrants | Kazakhstan | 95.9 /100 | #100 | Exceptional 10.7% |
| Immigrants | Greece | 95.6 /100 | #101 | Exceptional 10.7% |
| Immigrants | Eastern Europe | 95.3 /100 | #102 | Exceptional 10.7% |
| Uruguayans | 95.3 /100 | #103 | Exceptional 10.7% |
Demographics Similar to Blacks/African Americans by Male Disability
In terms of male disability, the demographic groups most similar to Blacks/African Americans are Scotch-Irish (13.2%, a difference of 0.32%), French Canadian (13.3%, a difference of 0.41%), Spanish American (13.3%, a difference of 0.61%), Arapaho (13.3%, a difference of 0.84%), and Crow (13.1%, a difference of 0.87%).
| Demographics | Rating | Rank | Male Disability |
| Inupiat | 0.0 /100 | #297 | Tragic 13.0% |
| Pennsylvania Germans | 0.0 /100 | #298 | Tragic 13.0% |
| Celtics | 0.0 /100 | #299 | Tragic 13.0% |
| Cheyenne | 0.0 /100 | #300 | Tragic 13.0% |
| French | 0.0 /100 | #301 | Tragic 13.0% |
| Crow | 0.0 /100 | #302 | Tragic 13.1% |
| Scotch-Irish | 0.0 /100 | #303 | Tragic 13.2% |
| Blacks/African Americans | 0.0 /100 | #304 | Tragic 13.2% |
| French Canadians | 0.0 /100 | #305 | Tragic 13.3% |
| Spanish Americans | 0.0 /100 | #306 | Tragic 13.3% |
| Arapaho | 0.0 /100 | #307 | Tragic 13.3% |
| French American Indians | 0.0 /100 | #308 | Tragic 13.4% |
| Blackfeet | 0.0 /100 | #309 | Tragic 13.4% |
| Immigrants | Azores | 0.0 /100 | #310 | Tragic 13.4% |
| Delaware | 0.0 /100 | #311 | Tragic 13.5% |