Japanese vs Immigrants from Peru Hearing Disability
COMPARE
Japanese
Immigrants from Peru
Hearing Disability
Hearing Disability Comparison
Japanese
Immigrants from Peru
3.0%
HEARING DISABILITY
46.0/ 100
METRIC RATING
178th/ 347
METRIC RANK
2.7%
HEARING DISABILITY
98.6/ 100
METRIC RATING
58th/ 347
METRIC RANK
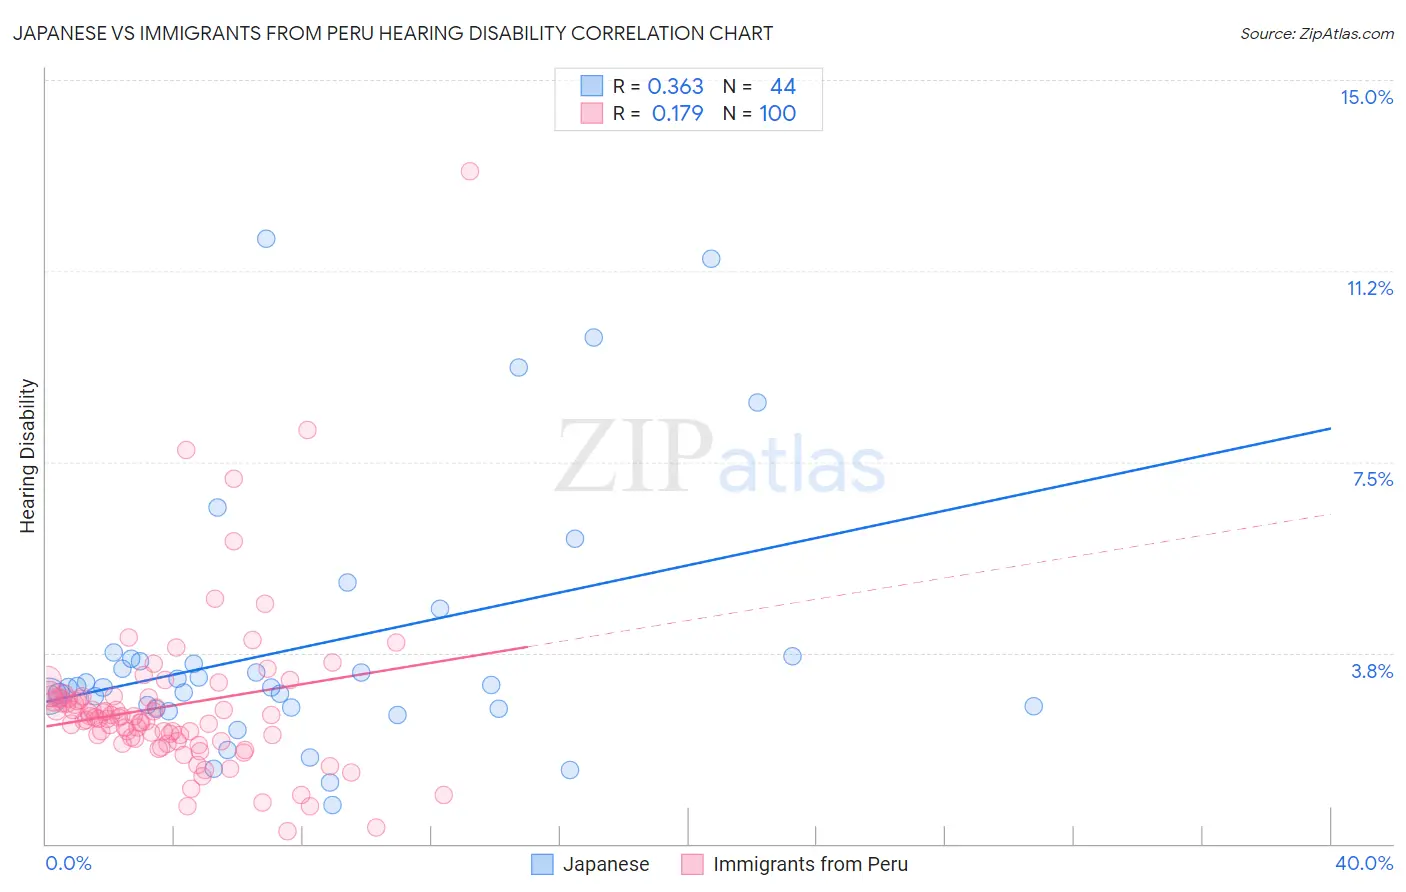
Japanese vs Immigrants from Peru Hearing Disability Correlation Chart
The statistical analysis conducted on geographies consisting of 249,105,269 people shows a mild positive correlation between the proportion of Japanese and percentage of population with hearing disability in the United States with a correlation coefficient (R) of 0.363 and weighted average of 3.0%. Similarly, the statistical analysis conducted on geographies consisting of 328,787,058 people shows a poor positive correlation between the proportion of Immigrants from Peru and percentage of population with hearing disability in the United States with a correlation coefficient (R) of 0.179 and weighted average of 2.7%, a difference of 11.5%.
Hearing Disability Correlation Summary
| Measurement | Japanese | Immigrants from Peru |
| Minimum | 0.75% | 0.24% |
| Maximum | 11.9% | 13.2% |
| Range | 11.1% | 13.0% |
| Mean | 3.9% | 2.7% |
| Median | 3.1% | 2.5% |
| Interquartile 25% (IQ1) | 2.7% | 2.0% |
| Interquartile 75% (IQ3) | 3.7% | 2.9% |
| Interquartile Range (IQR) | 1.0% | 0.85% |
| Standard Deviation (Sample) | 2.6% | 1.6% |
| Standard Deviation (Population) | 2.6% | 1.6% |
Similar Demographics by Hearing Disability
Demographics Similar to Japanese by Hearing Disability
In terms of hearing disability, the demographic groups most similar to Japanese are Immigrants from Philippines (3.0%, a difference of 0.040%), Panamanian (3.0%, a difference of 0.10%), Immigrants from Romania (3.0%, a difference of 0.23%), Immigrants from Moldova (3.0%, a difference of 0.28%), and Immigrants from Sweden (3.0%, a difference of 0.34%).
| Demographics | Rating | Rank | Hearing Disability |
| Immigrants | Ukraine | 56.6 /100 | #171 | Average 3.0% |
| Armenians | 56.0 /100 | #172 | Average 3.0% |
| Immigrants | Serbia | 51.1 /100 | #173 | Average 3.0% |
| Indonesians | 50.0 /100 | #174 | Average 3.0% |
| Immigrants | Romania | 48.4 /100 | #175 | Average 3.0% |
| Panamanians | 47.0 /100 | #176 | Average 3.0% |
| Immigrants | Philippines | 46.4 /100 | #177 | Average 3.0% |
| Japanese | 46.0 /100 | #178 | Average 3.0% |
| Immigrants | Moldova | 43.1 /100 | #179 | Average 3.0% |
| Immigrants | Sweden | 42.4 /100 | #180 | Average 3.0% |
| Immigrants | Belgium | 41.5 /100 | #181 | Average 3.0% |
| Immigrants | Italy | 41.1 /100 | #182 | Average 3.0% |
| Bulgarians | 39.7 /100 | #183 | Fair 3.0% |
| Immigrants | Ireland | 37.4 /100 | #184 | Fair 3.0% |
| Immigrants | Southern Europe | 35.3 /100 | #185 | Fair 3.0% |
Demographics Similar to Immigrants from Peru by Hearing Disability
In terms of hearing disability, the demographic groups most similar to Immigrants from Peru are Immigrants from Eritrea (2.7%, a difference of 0.11%), Immigrants from Egypt (2.7%, a difference of 0.18%), Immigrants from Uzbekistan (2.7%, a difference of 0.31%), Immigrants from Colombia (2.7%, a difference of 0.32%), and Indian (Asian) (2.7%, a difference of 0.37%).
| Demographics | Rating | Rank | Hearing Disability |
| Immigrants | Hong Kong | 99.2 /100 | #51 | Exceptional 2.7% |
| Jamaicans | 99.0 /100 | #52 | Exceptional 2.7% |
| Immigrants | Eastern Asia | 99.0 /100 | #53 | Exceptional 2.7% |
| Ethiopians | 99.0 /100 | #54 | Exceptional 2.7% |
| Immigrants | Ethiopia | 99.0 /100 | #55 | Exceptional 2.7% |
| Immigrants | Nicaragua | 99.0 /100 | #56 | Exceptional 2.7% |
| South Americans | 99.0 /100 | #57 | Exceptional 2.7% |
| Immigrants | Peru | 98.6 /100 | #58 | Exceptional 2.7% |
| Immigrants | Eritrea | 98.5 /100 | #59 | Exceptional 2.7% |
| Immigrants | Egypt | 98.5 /100 | #60 | Exceptional 2.7% |
| Immigrants | Uzbekistan | 98.4 /100 | #61 | Exceptional 2.7% |
| Immigrants | Colombia | 98.4 /100 | #62 | Exceptional 2.7% |
| Indians (Asian) | 98.4 /100 | #63 | Exceptional 2.7% |
| Immigrants | Sri Lanka | 98.4 /100 | #64 | Exceptional 2.7% |
| Immigrants | Nepal | 98.3 /100 | #65 | Exceptional 2.7% |