Nepalese vs Tohono O'odham Vision Disability
COMPARE
Nepalese
Tohono O'odham
Vision Disability
Vision Disability Comparison
Nepalese
Tohono O'odham
2.4%
VISION DISABILITY
0.0/ 100
METRIC RATING
279th/ 347
METRIC RANK
2.8%
VISION DISABILITY
0.0/ 100
METRIC RATING
319th/ 347
METRIC RANK
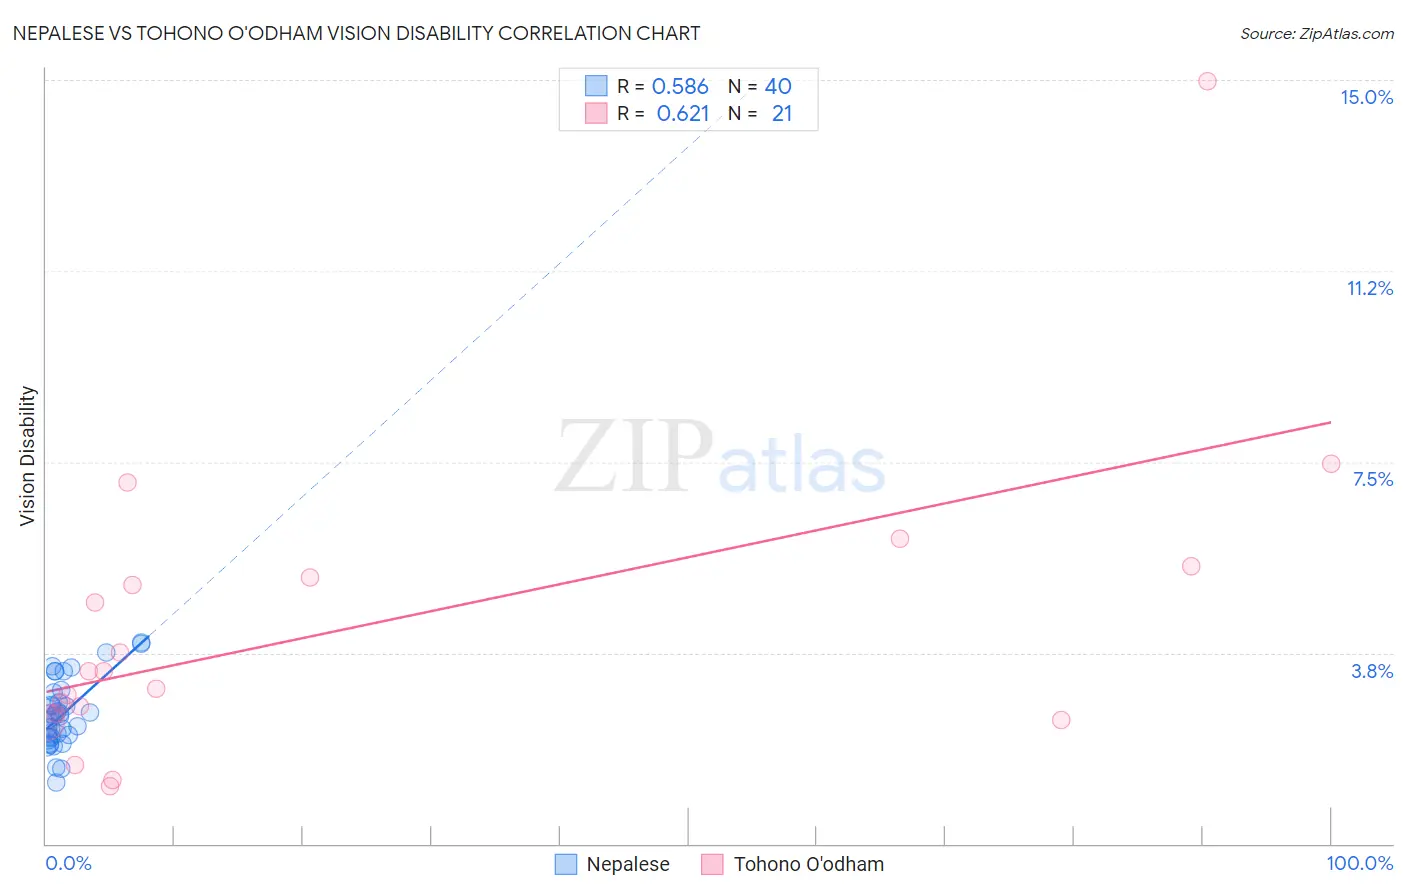
Nepalese vs Tohono O'odham Vision Disability Correlation Chart
The statistical analysis conducted on geographies consisting of 24,521,755 people shows a substantial positive correlation between the proportion of Nepalese and percentage of population with vision disability in the United States with a correlation coefficient (R) of 0.586 and weighted average of 2.4%. Similarly, the statistical analysis conducted on geographies consisting of 58,710,192 people shows a significant positive correlation between the proportion of Tohono O'odham and percentage of population with vision disability in the United States with a correlation coefficient (R) of 0.621 and weighted average of 2.8%, a difference of 13.2%.
Vision Disability Correlation Summary
| Measurement | Nepalese | Tohono O'odham |
| Minimum | 1.2% | 1.1% |
| Maximum | 3.9% | 15.0% |
| Range | 2.7% | 13.8% |
| Mean | 2.5% | 4.2% |
| Median | 2.5% | 3.4% |
| Interquartile 25% (IQ1) | 2.1% | 2.5% |
| Interquartile 75% (IQ3) | 2.9% | 5.3% |
| Interquartile Range (IQR) | 0.78% | 2.8% |
| Standard Deviation (Sample) | 0.66% | 3.0% |
| Standard Deviation (Population) | 0.65% | 3.0% |
Similar Demographics by Vision Disability
Demographics Similar to Nepalese by Vision Disability
In terms of vision disability, the demographic groups most similar to Nepalese are Spanish (2.4%, a difference of 0.010%), Cape Verdean (2.4%, a difference of 0.040%), Bahamian (2.4%, a difference of 0.17%), Scotch-Irish (2.4%, a difference of 0.21%), and U.S. Virgin Islander (2.5%, a difference of 0.27%).
| Demographics | Rating | Rank | Vision Disability |
| Spaniards | 0.1 /100 | #272 | Tragic 2.4% |
| Immigrants | Bahamas | 0.1 /100 | #273 | Tragic 2.4% |
| Immigrants | Latin America | 0.0 /100 | #274 | Tragic 2.4% |
| Chippewa | 0.0 /100 | #275 | Tragic 2.4% |
| Scotch-Irish | 0.0 /100 | #276 | Tragic 2.4% |
| Bahamians | 0.0 /100 | #277 | Tragic 2.4% |
| Spanish | 0.0 /100 | #278 | Tragic 2.4% |
| Nepalese | 0.0 /100 | #279 | Tragic 2.4% |
| Cape Verdeans | 0.0 /100 | #280 | Tragic 2.4% |
| U.S. Virgin Islanders | 0.0 /100 | #281 | Tragic 2.5% |
| Immigrants | Caribbean | 0.0 /100 | #282 | Tragic 2.5% |
| Puget Sound Salish | 0.0 /100 | #283 | Tragic 2.5% |
| Yakama | 0.0 /100 | #284 | Tragic 2.5% |
| Immigrants | Central America | 0.0 /100 | #285 | Tragic 2.5% |
| Sioux | 0.0 /100 | #286 | Tragic 2.5% |
Demographics Similar to Tohono O'odham by Vision Disability
In terms of vision disability, the demographic groups most similar to Tohono O'odham are Black/African American (2.8%, a difference of 0.69%), Alaska Native (2.7%, a difference of 1.4%), Yup'ik (2.7%, a difference of 2.5%), Comanche (2.8%, a difference of 2.7%), and Shoshone (2.7%, a difference of 2.7%).
| Demographics | Rating | Rank | Vision Disability |
| Americans | 0.0 /100 | #312 | Tragic 2.6% |
| Potawatomi | 0.0 /100 | #313 | Tragic 2.6% |
| Inupiat | 0.0 /100 | #314 | Tragic 2.7% |
| Osage | 0.0 /100 | #315 | Tragic 2.7% |
| Shoshone | 0.0 /100 | #316 | Tragic 2.7% |
| Yup'ik | 0.0 /100 | #317 | Tragic 2.7% |
| Alaska Natives | 0.0 /100 | #318 | Tragic 2.7% |
| Tohono O'odham | 0.0 /100 | #319 | Tragic 2.8% |
| Blacks/African Americans | 0.0 /100 | #320 | Tragic 2.8% |
| Comanche | 0.0 /100 | #321 | Tragic 2.8% |
| Paiute | 0.0 /100 | #322 | Tragic 2.9% |
| Tlingit-Haida | 0.0 /100 | #323 | Tragic 2.9% |
| Hopi | 0.0 /100 | #324 | Tragic 2.9% |
| Cherokee | 0.0 /100 | #325 | Tragic 2.9% |
| Spanish Americans | 0.0 /100 | #326 | Tragic 2.9% |