Nepalese vs Fijian Vision Disability
COMPARE
Nepalese
Fijian
Vision Disability
Vision Disability Comparison
Nepalese
Fijians
2.4%
VISION DISABILITY
0.0/ 100
METRIC RATING
279th/ 347
METRIC RANK
2.4%
VISION DISABILITY
0.1/ 100
METRIC RATING
261st/ 347
METRIC RANK
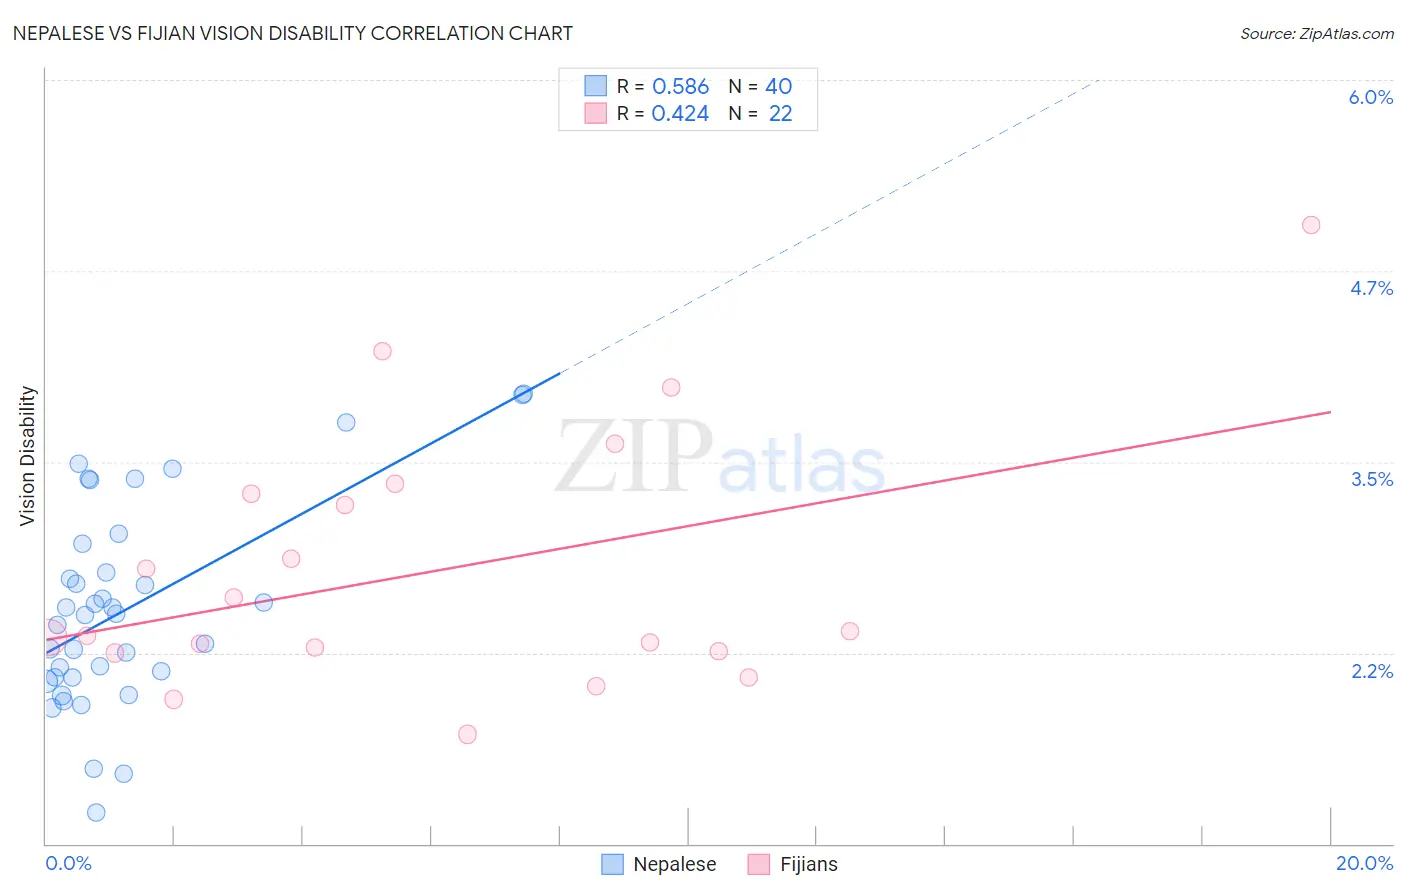
Nepalese vs Fijian Vision Disability Correlation Chart
The statistical analysis conducted on geographies consisting of 24,521,755 people shows a substantial positive correlation between the proportion of Nepalese and percentage of population with vision disability in the United States with a correlation coefficient (R) of 0.586 and weighted average of 2.4%. Similarly, the statistical analysis conducted on geographies consisting of 55,940,410 people shows a moderate positive correlation between the proportion of Fijians and percentage of population with vision disability in the United States with a correlation coefficient (R) of 0.424 and weighted average of 2.4%, a difference of 2.4%.
Vision Disability Correlation Summary
| Measurement | Nepalese | Fijian |
| Minimum | 1.2% | 1.7% |
| Maximum | 3.9% | 5.1% |
| Range | 2.7% | 3.3% |
| Mean | 2.5% | 2.8% |
| Median | 2.5% | 2.4% |
| Interquartile 25% (IQ1) | 2.1% | 2.3% |
| Interquartile 75% (IQ3) | 2.9% | 3.3% |
| Interquartile Range (IQR) | 0.78% | 1.0% |
| Standard Deviation (Sample) | 0.66% | 0.84% |
| Standard Deviation (Population) | 0.65% | 0.82% |
Demographics Similar to Nepalese and Fijians by Vision Disability
In terms of vision disability, the demographic groups most similar to Nepalese are Spanish (2.4%, a difference of 0.010%), Cape Verdean (2.4%, a difference of 0.040%), Bahamian (2.4%, a difference of 0.17%), Scotch-Irish (2.4%, a difference of 0.21%), and Chippewa (2.4%, a difference of 0.30%). Similarly, the demographic groups most similar to Fijians are Jamaican (2.4%, a difference of 0.030%), Belizean (2.4%, a difference of 0.21%), Immigrants from Belize (2.4%, a difference of 0.28%), Immigrants from Liberia (2.4%, a difference of 0.40%), and Immigrants from Jamaica (2.4%, a difference of 0.43%).
| Demographics | Rating | Rank | Vision Disability |
| Belizeans | 0.2 /100 | #260 | Tragic 2.4% |
| Fijians | 0.1 /100 | #261 | Tragic 2.4% |
| Jamaicans | 0.1 /100 | #262 | Tragic 2.4% |
| Immigrants | Belize | 0.1 /100 | #263 | Tragic 2.4% |
| Immigrants | Liberia | 0.1 /100 | #264 | Tragic 2.4% |
| Immigrants | Jamaica | 0.1 /100 | #265 | Tragic 2.4% |
| Mexican American Indians | 0.1 /100 | #266 | Tragic 2.4% |
| Ute | 0.1 /100 | #267 | Tragic 2.4% |
| Senegalese | 0.1 /100 | #268 | Tragic 2.4% |
| Celtics | 0.1 /100 | #269 | Tragic 2.4% |
| Cubans | 0.1 /100 | #270 | Tragic 2.4% |
| Immigrants | Azores | 0.1 /100 | #271 | Tragic 2.4% |
| Spaniards | 0.1 /100 | #272 | Tragic 2.4% |
| Immigrants | Bahamas | 0.1 /100 | #273 | Tragic 2.4% |
| Immigrants | Latin America | 0.0 /100 | #274 | Tragic 2.4% |
| Chippewa | 0.0 /100 | #275 | Tragic 2.4% |
| Scotch-Irish | 0.0 /100 | #276 | Tragic 2.4% |
| Bahamians | 0.0 /100 | #277 | Tragic 2.4% |
| Spanish | 0.0 /100 | #278 | Tragic 2.4% |
| Nepalese | 0.0 /100 | #279 | Tragic 2.4% |
| Cape Verdeans | 0.0 /100 | #280 | Tragic 2.4% |