Nepalese vs Immigrants from South Africa Vision Disability
COMPARE
Nepalese
Immigrants from South Africa
Vision Disability
Vision Disability Comparison
Nepalese
Immigrants from South Africa
2.4%
VISION DISABILITY
0.0/ 100
METRIC RATING
279th/ 347
METRIC RANK
2.1%
VISION DISABILITY
95.4/ 100
METRIC RATING
98th/ 347
METRIC RANK
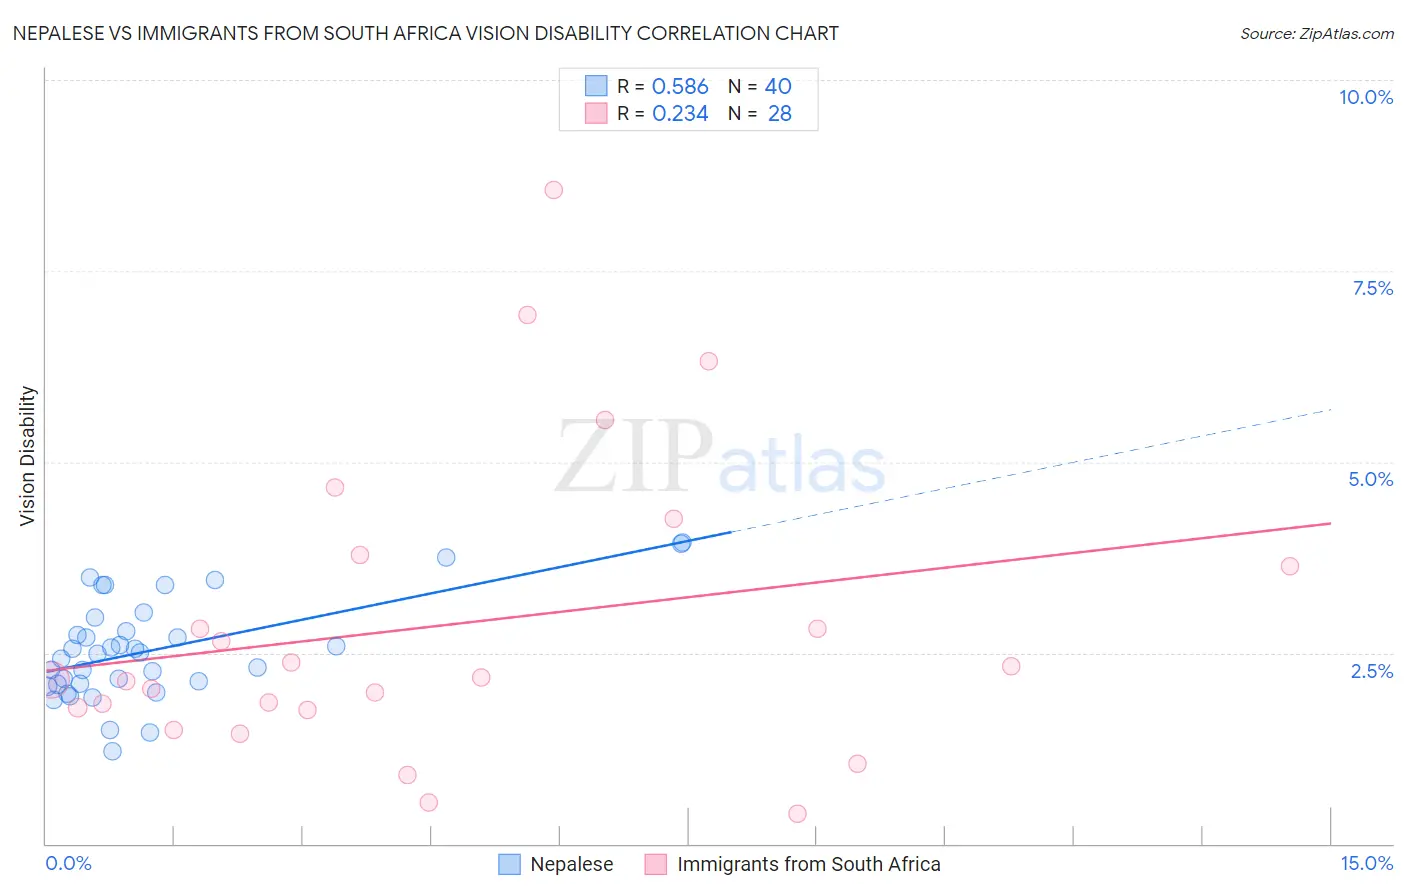
Nepalese vs Immigrants from South Africa Vision Disability Correlation Chart
The statistical analysis conducted on geographies consisting of 24,521,755 people shows a substantial positive correlation between the proportion of Nepalese and percentage of population with vision disability in the United States with a correlation coefficient (R) of 0.586 and weighted average of 2.4%. Similarly, the statistical analysis conducted on geographies consisting of 233,222,881 people shows a weak positive correlation between the proportion of Immigrants from South Africa and percentage of population with vision disability in the United States with a correlation coefficient (R) of 0.234 and weighted average of 2.1%, a difference of 18.5%.
Vision Disability Correlation Summary
| Measurement | Nepalese | Immigrants from South Africa |
| Minimum | 1.2% | 0.40% |
| Maximum | 3.9% | 8.6% |
| Range | 2.7% | 8.2% |
| Mean | 2.5% | 2.9% |
| Median | 2.5% | 2.2% |
| Interquartile 25% (IQ1) | 2.1% | 1.8% |
| Interquartile 75% (IQ3) | 2.9% | 3.7% |
| Interquartile Range (IQR) | 0.78% | 1.9% |
| Standard Deviation (Sample) | 0.66% | 2.0% |
| Standard Deviation (Population) | 0.65% | 1.9% |
Similar Demographics by Vision Disability
Demographics Similar to Nepalese by Vision Disability
In terms of vision disability, the demographic groups most similar to Nepalese are Spanish (2.4%, a difference of 0.010%), Cape Verdean (2.4%, a difference of 0.040%), Bahamian (2.4%, a difference of 0.17%), Scotch-Irish (2.4%, a difference of 0.21%), and U.S. Virgin Islander (2.5%, a difference of 0.27%).
| Demographics | Rating | Rank | Vision Disability |
| Spaniards | 0.1 /100 | #272 | Tragic 2.4% |
| Immigrants | Bahamas | 0.1 /100 | #273 | Tragic 2.4% |
| Immigrants | Latin America | 0.0 /100 | #274 | Tragic 2.4% |
| Chippewa | 0.0 /100 | #275 | Tragic 2.4% |
| Scotch-Irish | 0.0 /100 | #276 | Tragic 2.4% |
| Bahamians | 0.0 /100 | #277 | Tragic 2.4% |
| Spanish | 0.0 /100 | #278 | Tragic 2.4% |
| Nepalese | 0.0 /100 | #279 | Tragic 2.4% |
| Cape Verdeans | 0.0 /100 | #280 | Tragic 2.4% |
| U.S. Virgin Islanders | 0.0 /100 | #281 | Tragic 2.5% |
| Immigrants | Caribbean | 0.0 /100 | #282 | Tragic 2.5% |
| Puget Sound Salish | 0.0 /100 | #283 | Tragic 2.5% |
| Yakama | 0.0 /100 | #284 | Tragic 2.5% |
| Immigrants | Central America | 0.0 /100 | #285 | Tragic 2.5% |
| Sioux | 0.0 /100 | #286 | Tragic 2.5% |
Demographics Similar to Immigrants from South Africa by Vision Disability
In terms of vision disability, the demographic groups most similar to Immigrants from South Africa are Immigrants from Afghanistan (2.1%, a difference of 0.050%), Estonian (2.1%, a difference of 0.070%), Romanian (2.1%, a difference of 0.11%), Greek (2.1%, a difference of 0.11%), and Australian (2.1%, a difference of 0.17%).
| Demographics | Rating | Rank | Vision Disability |
| Immigrants | Somalia | 96.2 /100 | #91 | Exceptional 2.1% |
| Immigrants | Syria | 96.2 /100 | #92 | Exceptional 2.1% |
| Immigrants | Europe | 96.1 /100 | #93 | Exceptional 2.1% |
| Immigrants | Croatia | 96.0 /100 | #94 | Exceptional 2.1% |
| Australians | 95.9 /100 | #95 | Exceptional 2.1% |
| Romanians | 95.7 /100 | #96 | Exceptional 2.1% |
| Immigrants | Afghanistan | 95.6 /100 | #97 | Exceptional 2.1% |
| Immigrants | South Africa | 95.4 /100 | #98 | Exceptional 2.1% |
| Estonians | 95.3 /100 | #99 | Exceptional 2.1% |
| Greeks | 95.1 /100 | #100 | Exceptional 2.1% |
| Albanians | 94.9 /100 | #101 | Exceptional 2.1% |
| Sri Lankans | 94.8 /100 | #102 | Exceptional 2.1% |
| Immigrants | Austria | 94.4 /100 | #103 | Exceptional 2.1% |
| Immigrants | Italy | 94.4 /100 | #104 | Exceptional 2.1% |
| Carpatho Rusyns | 94.3 /100 | #105 | Exceptional 2.1% |