Immigrants from Bulgaria vs Serbian Male Disability
COMPARE
Immigrants from Bulgaria
Serbian
Male Disability
Male Disability Comparison
Immigrants from Bulgaria
Serbians
10.5%
MALE DISABILITY
99.1/ 100
METRIC RATING
70th/ 347
METRIC RANK
11.5%
MALE DISABILITY
10.7/ 100
METRIC RATING
205th/ 347
METRIC RANK
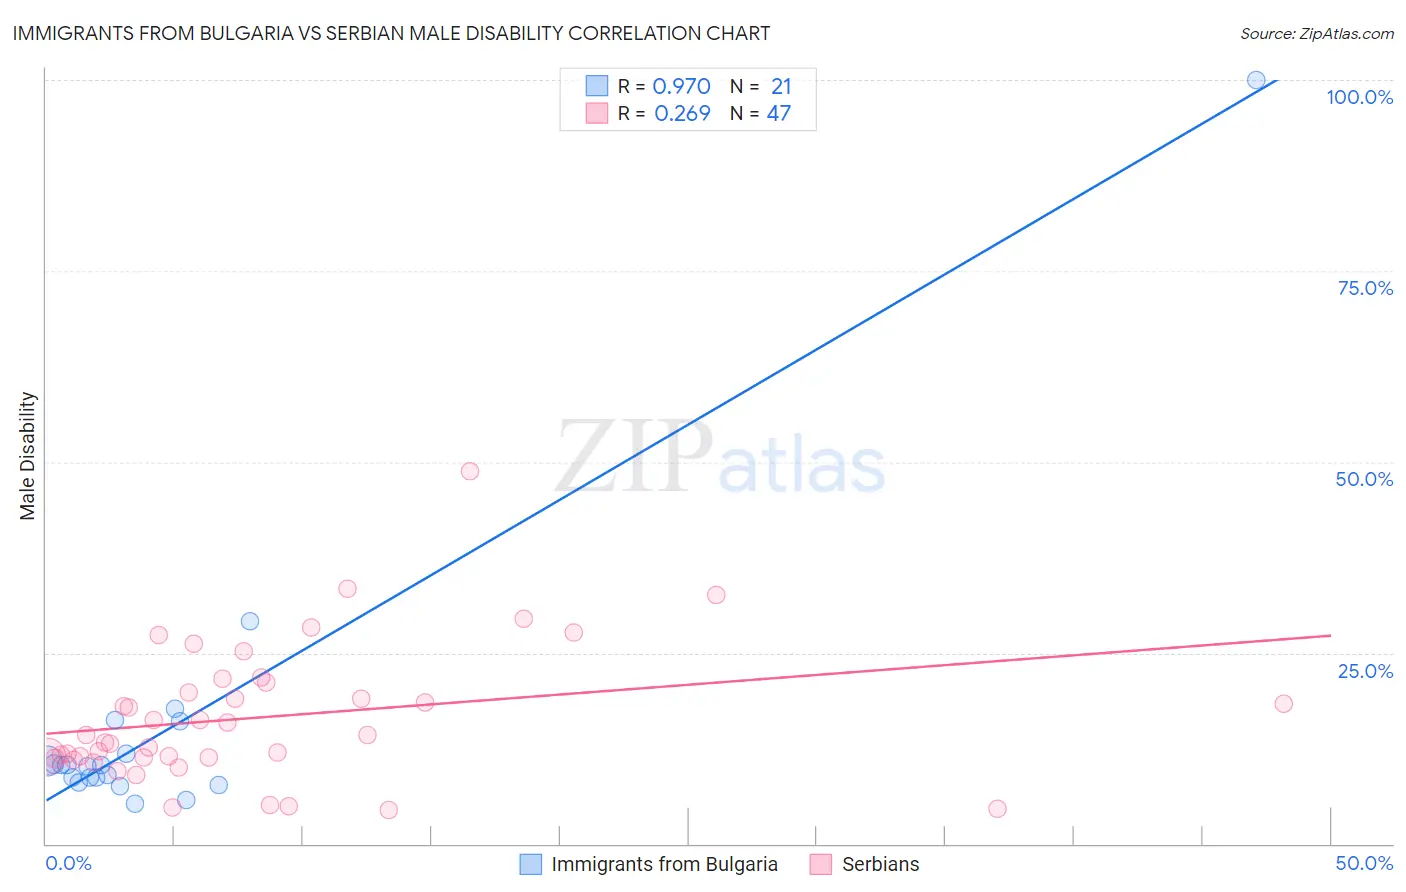
Immigrants from Bulgaria vs Serbian Male Disability Correlation Chart
The statistical analysis conducted on geographies consisting of 172,550,350 people shows a perfect positive correlation between the proportion of Immigrants from Bulgaria and percentage of males with a disability in the United States with a correlation coefficient (R) of 0.970 and weighted average of 10.5%. Similarly, the statistical analysis conducted on geographies consisting of 267,640,230 people shows a weak positive correlation between the proportion of Serbians and percentage of males with a disability in the United States with a correlation coefficient (R) of 0.269 and weighted average of 11.5%, a difference of 10.1%.
Male Disability Correlation Summary
| Measurement | Immigrants from Bulgaria | Serbian |
| Minimum | 5.2% | 4.5% |
| Maximum | 100.0% | 48.7% |
| Range | 94.8% | 44.3% |
| Mean | 15.4% | 16.6% |
| Median | 10.3% | 14.3% |
| Interquartile 25% (IQ1) | 8.3% | 11.3% |
| Interquartile 75% (IQ3) | 14.0% | 21.0% |
| Interquartile Range (IQR) | 5.7% | 9.7% |
| Standard Deviation (Sample) | 20.1% | 8.8% |
| Standard Deviation (Population) | 19.6% | 8.8% |
Similar Demographics by Male Disability
Demographics Similar to Immigrants from Bulgaria by Male Disability
In terms of male disability, the demographic groups most similar to Immigrants from Bulgaria are Colombian (10.5%, a difference of 0.14%), Ecuadorian (10.5%, a difference of 0.14%), Immigrants from Cameroon (10.5%, a difference of 0.15%), Immigrants from Serbia (10.5%, a difference of 0.20%), and Immigrants from Afghanistan (10.5%, a difference of 0.24%).
| Demographics | Rating | Rank | Male Disability |
| Immigrants | Belarus | 99.3 /100 | #63 | Exceptional 10.4% |
| Jordanians | 99.3 /100 | #64 | Exceptional 10.5% |
| Immigrants | Grenada | 99.2 /100 | #65 | Exceptional 10.5% |
| Guyanese | 99.2 /100 | #66 | Exceptional 10.5% |
| Immigrants | Afghanistan | 99.2 /100 | #67 | Exceptional 10.5% |
| Colombians | 99.2 /100 | #68 | Exceptional 10.5% |
| Ecuadorians | 99.2 /100 | #69 | Exceptional 10.5% |
| Immigrants | Bulgaria | 99.1 /100 | #70 | Exceptional 10.5% |
| Immigrants | Cameroon | 99.0 /100 | #71 | Exceptional 10.5% |
| Immigrants | Serbia | 99.0 /100 | #72 | Exceptional 10.5% |
| Immigrants | Lithuania | 98.9 /100 | #73 | Exceptional 10.5% |
| Immigrants | Lebanon | 98.8 /100 | #74 | Exceptional 10.5% |
| Sierra Leoneans | 98.7 /100 | #75 | Exceptional 10.5% |
| Immigrants | Sierra Leone | 98.7 /100 | #76 | Exceptional 10.5% |
| Laotians | 98.6 /100 | #77 | Exceptional 10.6% |
Demographics Similar to Serbians by Male Disability
In terms of male disability, the demographic groups most similar to Serbians are Immigrants from Cambodia (11.5%, a difference of 0.0%), Ukrainian (11.5%, a difference of 0.010%), Jamaican (11.5%, a difference of 0.020%), Immigrants from Somalia (11.5%, a difference of 0.040%), and Icelander (11.6%, a difference of 0.080%).
| Demographics | Rating | Rank | Male Disability |
| Immigrants | Jamaica | 16.3 /100 | #198 | Poor 11.5% |
| Lebanese | 15.4 /100 | #199 | Poor 11.5% |
| Immigrants | Iraq | 13.0 /100 | #200 | Poor 11.5% |
| Immigrants | Panama | 13.0 /100 | #201 | Poor 11.5% |
| Immigrants | Mexico | 12.6 /100 | #202 | Poor 11.5% |
| Jamaicans | 10.9 /100 | #203 | Poor 11.5% |
| Immigrants | Cambodia | 10.8 /100 | #204 | Poor 11.5% |
| Serbians | 10.7 /100 | #205 | Poor 11.5% |
| Ukrainians | 10.6 /100 | #206 | Poor 11.5% |
| Immigrants | Somalia | 10.4 /100 | #207 | Poor 11.5% |
| Icelanders | 10.1 /100 | #208 | Poor 11.6% |
| Spanish American Indians | 10.1 /100 | #209 | Poor 11.6% |
| Ute | 9.4 /100 | #210 | Tragic 11.6% |
| Immigrants | Thailand | 8.4 /100 | #211 | Tragic 11.6% |
| Immigrants | Scotland | 8.2 /100 | #212 | Tragic 11.6% |