Navajo vs Immigrants from Colombia Self-Care Disability
COMPARE
Navajo
Immigrants from Colombia
Self-Care Disability
Self-Care Disability Comparison
Navajo
Immigrants from Colombia
2.9%
SELF-CARE DISABILITY
0.0/ 100
METRIC RATING
321st/ 347
METRIC RANK
2.4%
SELF-CARE DISABILITY
88.5/ 100
METRIC RATING
133rd/ 347
METRIC RANK
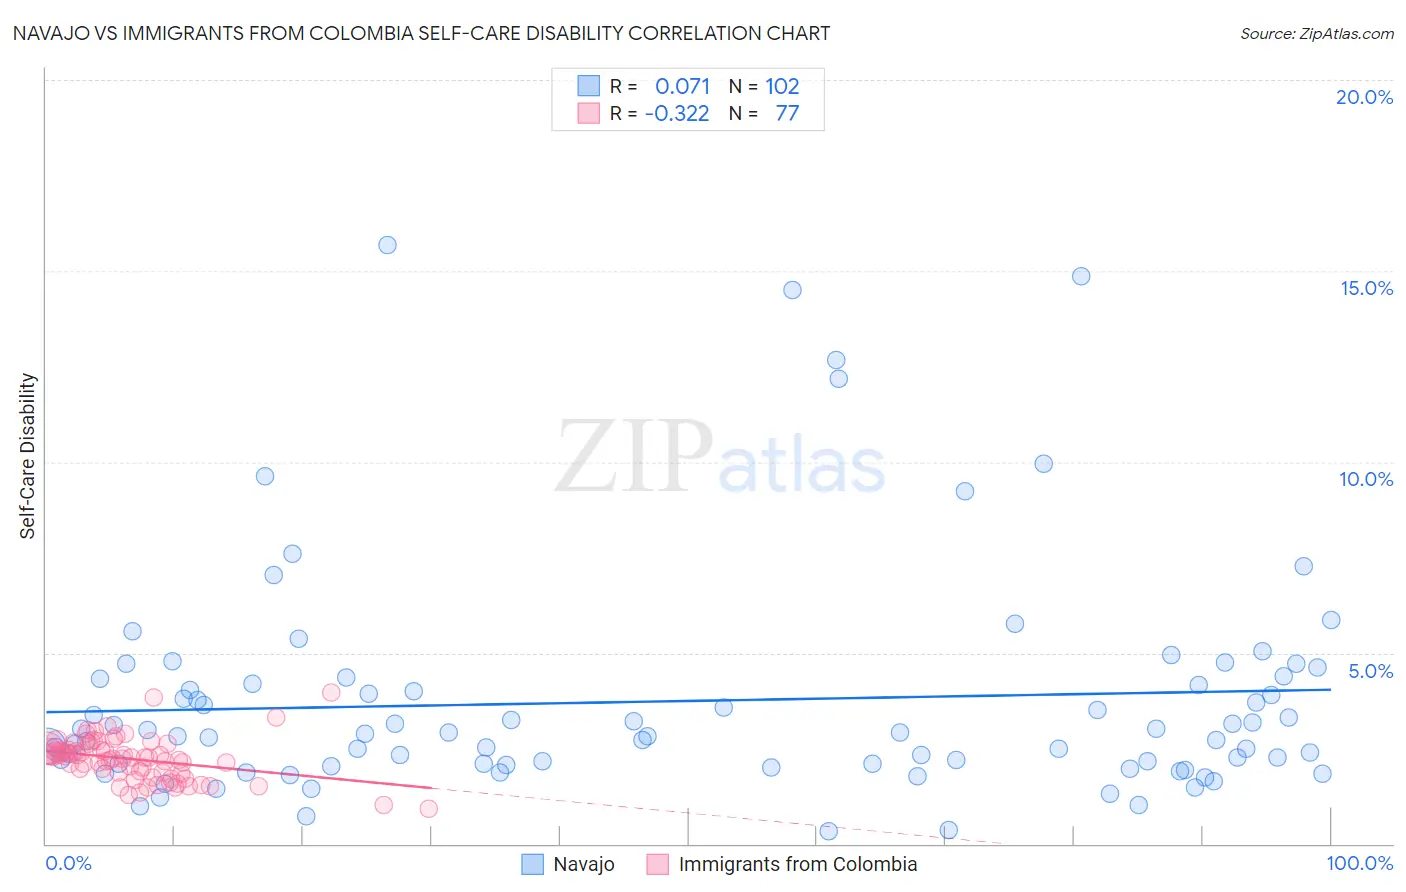
Navajo vs Immigrants from Colombia Self-Care Disability Correlation Chart
The statistical analysis conducted on geographies consisting of 224,543,915 people shows a slight positive correlation between the proportion of Navajo and percentage of population with self-care disability in the United States with a correlation coefficient (R) of 0.071 and weighted average of 2.9%. Similarly, the statistical analysis conducted on geographies consisting of 378,342,946 people shows a mild negative correlation between the proportion of Immigrants from Colombia and percentage of population with self-care disability in the United States with a correlation coefficient (R) of -0.322 and weighted average of 2.4%, a difference of 19.0%.
Self-Care Disability Correlation Summary
| Measurement | Navajo | Immigrants from Colombia |
| Minimum | 0.33% | 0.93% |
| Maximum | 15.7% | 4.0% |
| Range | 15.4% | 3.0% |
| Mean | 3.7% | 2.2% |
| Median | 2.9% | 2.3% |
| Interquartile 25% (IQ1) | 2.1% | 1.8% |
| Interquartile 75% (IQ3) | 4.2% | 2.5% |
| Interquartile Range (IQR) | 2.1% | 0.62% |
| Standard Deviation (Sample) | 3.0% | 0.56% |
| Standard Deviation (Population) | 2.9% | 0.56% |
Similar Demographics by Self-Care Disability
Demographics Similar to Navajo by Self-Care Disability
In terms of self-care disability, the demographic groups most similar to Navajo are Chickasaw (2.9%, a difference of 0.15%), Comanche (2.9%, a difference of 0.32%), Spanish American Indian (2.9%, a difference of 0.37%), Seminole (2.9%, a difference of 0.45%), and Assyrian/Chaldean/Syriac (2.8%, a difference of 0.52%).
| Demographics | Rating | Rank | Self-Care Disability |
| Creek | 0.0 /100 | #314 | Tragic 2.8% |
| Immigrants | Cuba | 0.0 /100 | #315 | Tragic 2.8% |
| Menominee | 0.0 /100 | #316 | Tragic 2.8% |
| Immigrants | Dominica | 0.0 /100 | #317 | Tragic 2.8% |
| Assyrians/Chaldeans/Syriacs | 0.0 /100 | #318 | Tragic 2.8% |
| Spanish American Indians | 0.0 /100 | #319 | Tragic 2.9% |
| Chickasaw | 0.0 /100 | #320 | Tragic 2.9% |
| Navajo | 0.0 /100 | #321 | Tragic 2.9% |
| Comanche | 0.0 /100 | #322 | Tragic 2.9% |
| Seminole | 0.0 /100 | #323 | Tragic 2.9% |
| Cherokee | 0.0 /100 | #324 | Tragic 2.9% |
| Immigrants | Uzbekistan | 0.0 /100 | #325 | Tragic 2.9% |
| Paiute | 0.0 /100 | #326 | Tragic 2.9% |
| Blacks/African Americans | 0.0 /100 | #327 | Tragic 2.9% |
| Hopi | 0.0 /100 | #328 | Tragic 2.9% |
Demographics Similar to Immigrants from Colombia by Self-Care Disability
In terms of self-care disability, the demographic groups most similar to Immigrants from Colombia are Immigrants from South America (2.4%, a difference of 0.030%), Polish (2.4%, a difference of 0.040%), Russian (2.4%, a difference of 0.040%), Immigrants from Austria (2.4%, a difference of 0.060%), and Immigrants from Romania (2.4%, a difference of 0.090%).
| Demographics | Rating | Rank | Self-Care Disability |
| Hmong | 89.9 /100 | #126 | Excellent 2.4% |
| Colombians | 89.7 /100 | #127 | Excellent 2.4% |
| Immigrants | Hungary | 89.6 /100 | #128 | Excellent 2.4% |
| Immigrants | Romania | 89.3 /100 | #129 | Excellent 2.4% |
| Immigrants | Austria | 89.0 /100 | #130 | Excellent 2.4% |
| Poles | 88.9 /100 | #131 | Excellent 2.4% |
| Immigrants | South America | 88.8 /100 | #132 | Excellent 2.4% |
| Immigrants | Colombia | 88.5 /100 | #133 | Excellent 2.4% |
| Russians | 88.2 /100 | #134 | Excellent 2.4% |
| Laotians | 87.8 /100 | #135 | Excellent 2.4% |
| South American Indians | 87.2 /100 | #136 | Excellent 2.4% |
| Austrians | 87.0 /100 | #137 | Excellent 2.4% |
| Immigrants | Croatia | 86.6 /100 | #138 | Excellent 2.4% |
| Sri Lankans | 86.6 /100 | #139 | Excellent 2.4% |
| Immigrants | Uruguay | 85.4 /100 | #140 | Excellent 2.4% |