Immigrants from Belgium vs Immigrants from Colombia Self-Care Disability
COMPARE
Immigrants from Belgium
Immigrants from Colombia
Self-Care Disability
Self-Care Disability Comparison
Immigrants from Belgium
Immigrants from Colombia
2.3%
SELF-CARE DISABILITY
99.6/ 100
METRIC RATING
57th/ 347
METRIC RANK
2.4%
SELF-CARE DISABILITY
88.5/ 100
METRIC RATING
133rd/ 347
METRIC RANK
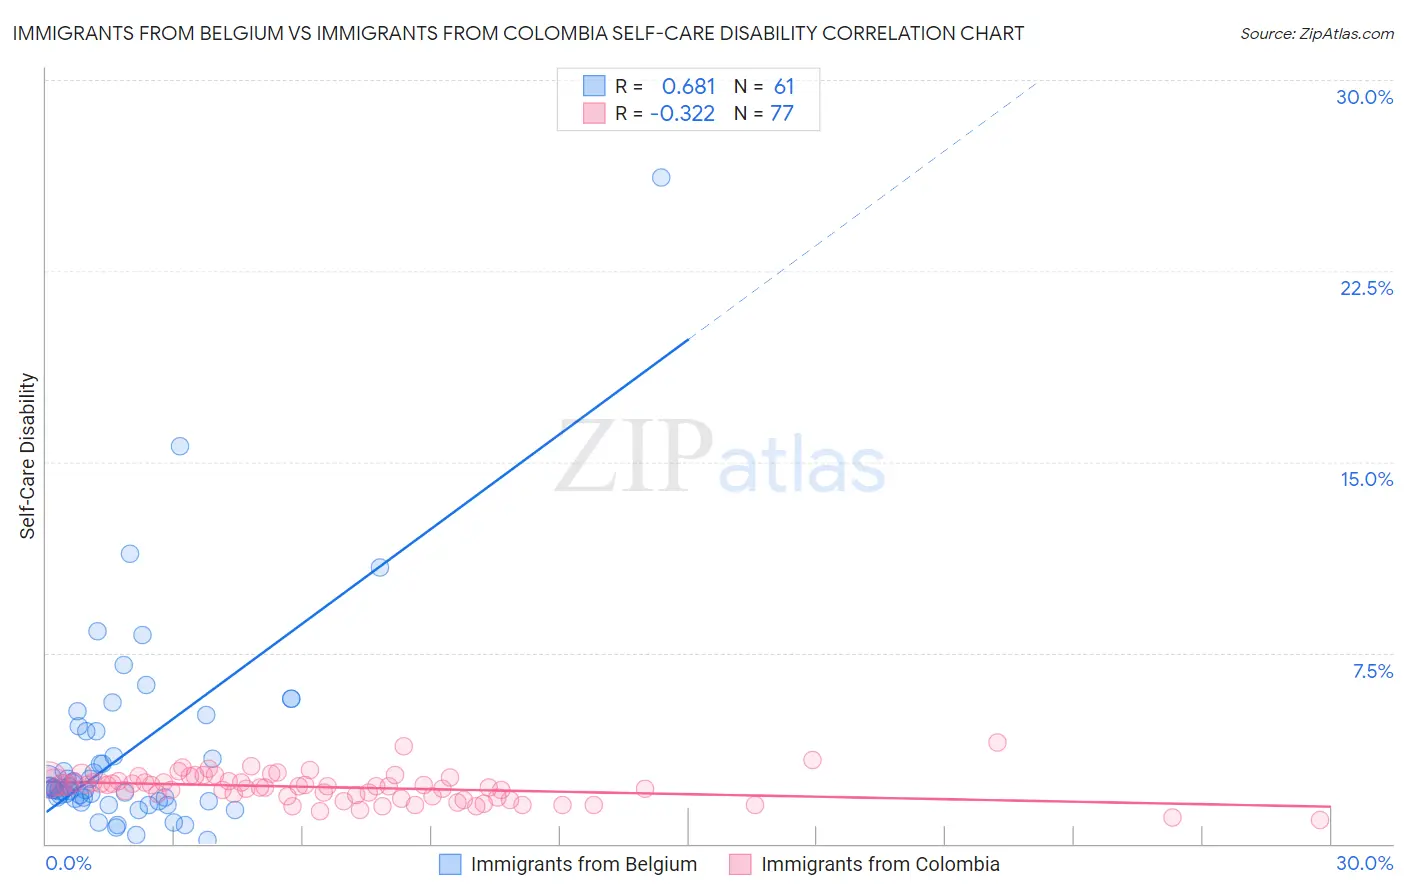
Immigrants from Belgium vs Immigrants from Colombia Self-Care Disability Correlation Chart
The statistical analysis conducted on geographies consisting of 146,636,859 people shows a significant positive correlation between the proportion of Immigrants from Belgium and percentage of population with self-care disability in the United States with a correlation coefficient (R) of 0.681 and weighted average of 2.3%. Similarly, the statistical analysis conducted on geographies consisting of 378,342,946 people shows a mild negative correlation between the proportion of Immigrants from Colombia and percentage of population with self-care disability in the United States with a correlation coefficient (R) of -0.322 and weighted average of 2.4%, a difference of 4.4%.
Self-Care Disability Correlation Summary
| Measurement | Immigrants from Belgium | Immigrants from Colombia |
| Minimum | 0.13% | 0.93% |
| Maximum | 26.2% | 4.0% |
| Range | 26.1% | 3.0% |
| Mean | 3.6% | 2.2% |
| Median | 2.2% | 2.3% |
| Interquartile 25% (IQ1) | 1.7% | 1.8% |
| Interquartile 75% (IQ3) | 4.4% | 2.5% |
| Interquartile Range (IQR) | 2.7% | 0.62% |
| Standard Deviation (Sample) | 4.1% | 0.56% |
| Standard Deviation (Population) | 4.1% | 0.56% |
Similar Demographics by Self-Care Disability
Demographics Similar to Immigrants from Belgium by Self-Care Disability
In terms of self-care disability, the demographic groups most similar to Immigrants from Belgium are Immigrants from Eastern Asia (2.3%, a difference of 0.010%), Immigrants from France (2.3%, a difference of 0.040%), Immigrants from Cameroon (2.3%, a difference of 0.070%), Argentinean (2.3%, a difference of 0.11%), and Australian (2.3%, a difference of 0.15%).
| Demographics | Rating | Rank | Self-Care Disability |
| Immigrants | Brazil | 99.7 /100 | #50 | Exceptional 2.3% |
| Kenyans | 99.7 /100 | #51 | Exceptional 2.3% |
| Immigrants | Serbia | 99.6 /100 | #52 | Exceptional 2.3% |
| Australians | 99.6 /100 | #53 | Exceptional 2.3% |
| Argentineans | 99.6 /100 | #54 | Exceptional 2.3% |
| Immigrants | France | 99.6 /100 | #55 | Exceptional 2.3% |
| Immigrants | Eastern Asia | 99.6 /100 | #56 | Exceptional 2.3% |
| Immigrants | Belgium | 99.6 /100 | #57 | Exceptional 2.3% |
| Immigrants | Cameroon | 99.6 /100 | #58 | Exceptional 2.3% |
| New Zealanders | 99.5 /100 | #59 | Exceptional 2.3% |
| Immigrants | Japan | 99.5 /100 | #60 | Exceptional 2.3% |
| Palestinians | 99.4 /100 | #61 | Exceptional 2.3% |
| Egyptians | 99.4 /100 | #62 | Exceptional 2.3% |
| Mongolians | 99.3 /100 | #63 | Exceptional 2.3% |
| Swedes | 99.3 /100 | #64 | Exceptional 2.3% |
Demographics Similar to Immigrants from Colombia by Self-Care Disability
In terms of self-care disability, the demographic groups most similar to Immigrants from Colombia are Immigrants from South America (2.4%, a difference of 0.030%), Polish (2.4%, a difference of 0.040%), Russian (2.4%, a difference of 0.040%), Immigrants from Austria (2.4%, a difference of 0.060%), and Immigrants from Romania (2.4%, a difference of 0.090%).
| Demographics | Rating | Rank | Self-Care Disability |
| Hmong | 89.9 /100 | #126 | Excellent 2.4% |
| Colombians | 89.7 /100 | #127 | Excellent 2.4% |
| Immigrants | Hungary | 89.6 /100 | #128 | Excellent 2.4% |
| Immigrants | Romania | 89.3 /100 | #129 | Excellent 2.4% |
| Immigrants | Austria | 89.0 /100 | #130 | Excellent 2.4% |
| Poles | 88.9 /100 | #131 | Excellent 2.4% |
| Immigrants | South America | 88.8 /100 | #132 | Excellent 2.4% |
| Immigrants | Colombia | 88.5 /100 | #133 | Excellent 2.4% |
| Russians | 88.2 /100 | #134 | Excellent 2.4% |
| Laotians | 87.8 /100 | #135 | Excellent 2.4% |
| South American Indians | 87.2 /100 | #136 | Excellent 2.4% |
| Austrians | 87.0 /100 | #137 | Excellent 2.4% |
| Immigrants | Croatia | 86.6 /100 | #138 | Excellent 2.4% |
| Sri Lankans | 86.6 /100 | #139 | Excellent 2.4% |
| Immigrants | Uruguay | 85.4 /100 | #140 | Excellent 2.4% |