Navajo vs Immigrants from Colombia Cognitive Disability
COMPARE
Navajo
Immigrants from Colombia
Cognitive Disability
Cognitive Disability Comparison
Navajo
Immigrants from Colombia
18.8%
COGNITIVE DISABILITY
0.0/ 100
METRIC RATING
329th/ 347
METRIC RANK
16.5%
COGNITIVE DISABILITY
99.8/ 100
METRIC RATING
46th/ 347
METRIC RANK
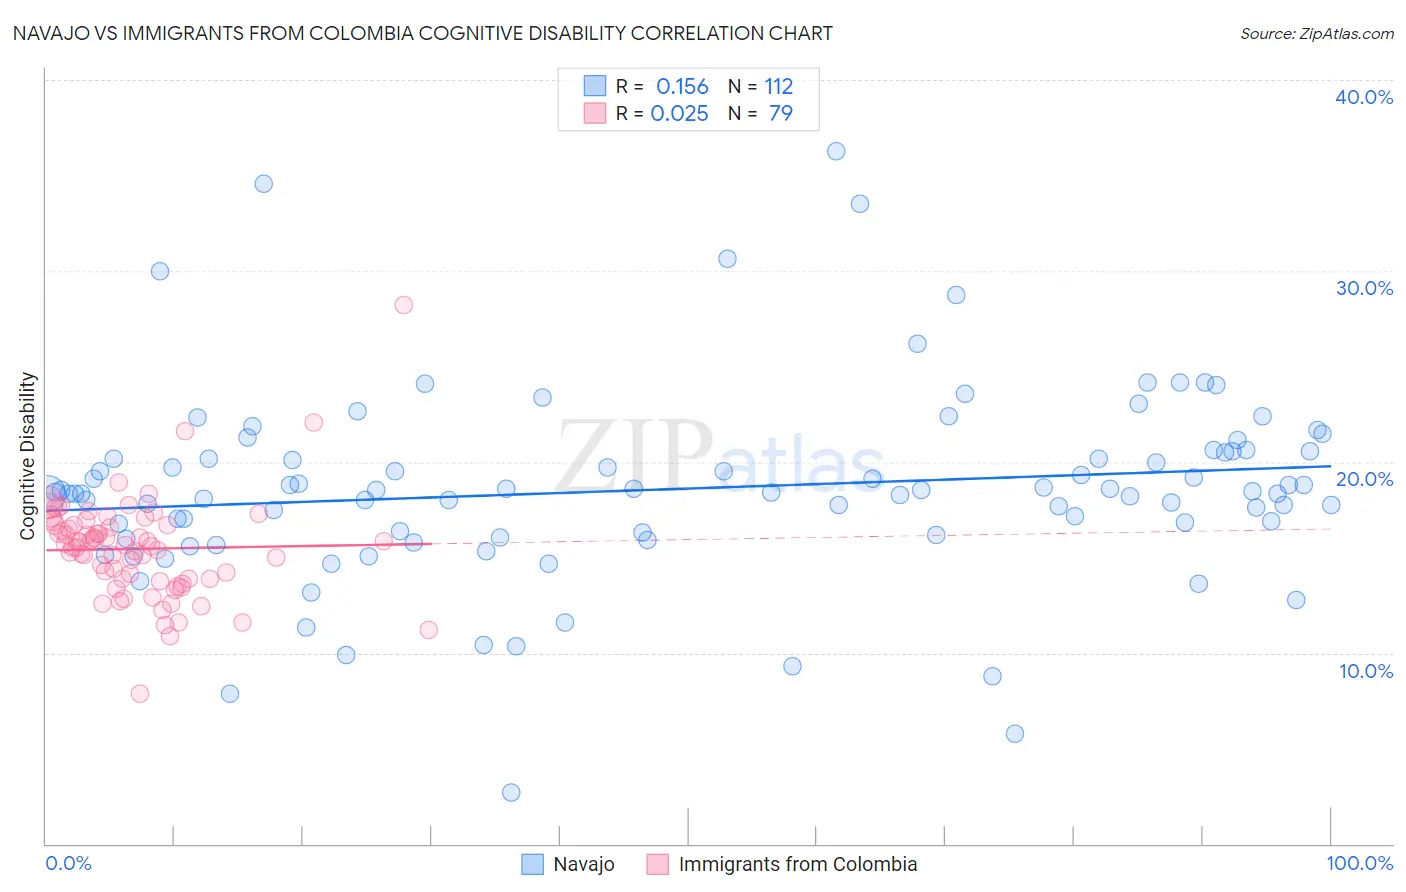
Navajo vs Immigrants from Colombia Cognitive Disability Correlation Chart
The statistical analysis conducted on geographies consisting of 224,779,988 people shows a poor positive correlation between the proportion of Navajo and percentage of population with cognitive disability in the United States with a correlation coefficient (R) of 0.156 and weighted average of 18.8%. Similarly, the statistical analysis conducted on geographies consisting of 378,642,533 people shows no correlation between the proportion of Immigrants from Colombia and percentage of population with cognitive disability in the United States with a correlation coefficient (R) of 0.025 and weighted average of 16.5%, a difference of 13.8%.
Cognitive Disability Correlation Summary
| Measurement | Navajo | Immigrants from Colombia |
| Minimum | 2.7% | 7.9% |
| Maximum | 36.3% | 28.2% |
| Range | 33.6% | 20.3% |
| Mean | 18.6% | 15.4% |
| Median | 18.4% | 15.7% |
| Interquartile 25% (IQ1) | 16.2% | 13.9% |
| Interquartile 75% (IQ3) | 20.5% | 16.7% |
| Interquartile Range (IQR) | 4.3% | 2.8% |
| Standard Deviation (Sample) | 5.1% | 2.7% |
| Standard Deviation (Population) | 5.1% | 2.7% |
Similar Demographics by Cognitive Disability
Demographics Similar to Navajo by Cognitive Disability
In terms of cognitive disability, the demographic groups most similar to Navajo are Immigrants from Dominican Republic (18.8%, a difference of 0.10%), Pima (18.8%, a difference of 0.16%), Immigrants from Sudan (18.8%, a difference of 0.18%), Kiowa (18.7%, a difference of 0.22%), and Immigrants from Yemen (18.8%, a difference of 0.24%).
| Demographics | Rating | Rank | Cognitive Disability |
| Immigrants | Liberia | 0.0 /100 | #322 | Tragic 18.7% |
| Pueblo | 0.0 /100 | #323 | Tragic 18.7% |
| Dominicans | 0.0 /100 | #324 | Tragic 18.7% |
| Indonesians | 0.0 /100 | #325 | Tragic 18.7% |
| Immigrants | Senegal | 0.0 /100 | #326 | Tragic 18.7% |
| U.S. Virgin Islanders | 0.0 /100 | #327 | Tragic 18.7% |
| Kiowa | 0.0 /100 | #328 | Tragic 18.7% |
| Navajo | 0.0 /100 | #329 | Tragic 18.8% |
| Immigrants | Dominican Republic | 0.0 /100 | #330 | Tragic 18.8% |
| Pima | 0.0 /100 | #331 | Tragic 18.8% |
| Immigrants | Sudan | 0.0 /100 | #332 | Tragic 18.8% |
| Immigrants | Yemen | 0.0 /100 | #333 | Tragic 18.8% |
| Sudanese | 0.0 /100 | #334 | Tragic 18.9% |
| Senegalese | 0.0 /100 | #335 | Tragic 19.0% |
| Blacks/African Americans | 0.0 /100 | #336 | Tragic 19.0% |
Demographics Similar to Immigrants from Colombia by Cognitive Disability
In terms of cognitive disability, the demographic groups most similar to Immigrants from Colombia are Immigrants from Europe (16.5%, a difference of 0.010%), Macedonian (16.5%, a difference of 0.020%), Immigrants from Italy (16.5%, a difference of 0.030%), Immigrants from North America (16.5%, a difference of 0.030%), and Immigrants from Canada (16.5%, a difference of 0.050%).
| Demographics | Rating | Rank | Cognitive Disability |
| Bolivians | 99.9 /100 | #39 | Exceptional 16.5% |
| Immigrants | Belarus | 99.9 /100 | #40 | Exceptional 16.5% |
| Cubans | 99.9 /100 | #41 | Exceptional 16.5% |
| Hungarians | 99.9 /100 | #42 | Exceptional 16.5% |
| Immigrants | Canada | 99.8 /100 | #43 | Exceptional 16.5% |
| Macedonians | 99.8 /100 | #44 | Exceptional 16.5% |
| Immigrants | Europe | 99.8 /100 | #45 | Exceptional 16.5% |
| Immigrants | Colombia | 99.8 /100 | #46 | Exceptional 16.5% |
| Immigrants | Italy | 99.8 /100 | #47 | Exceptional 16.5% |
| Immigrants | North America | 99.8 /100 | #48 | Exceptional 16.5% |
| Iranians | 99.8 /100 | #49 | Exceptional 16.5% |
| Norwegians | 99.8 /100 | #50 | Exceptional 16.5% |
| Immigrants | Korea | 99.8 /100 | #51 | Exceptional 16.5% |
| Soviet Union | 99.8 /100 | #52 | Exceptional 16.5% |
| Swedes | 99.8 /100 | #53 | Exceptional 16.5% |