Navajo vs Latvian Self-Care Disability
COMPARE
Navajo
Latvian
Self-Care Disability
Self-Care Disability Comparison
Navajo
Latvians
2.9%
SELF-CARE DISABILITY
0.0/ 100
METRIC RATING
321st/ 347
METRIC RANK
2.3%
SELF-CARE DISABILITY
99.7/ 100
METRIC RATING
49th/ 347
METRIC RANK
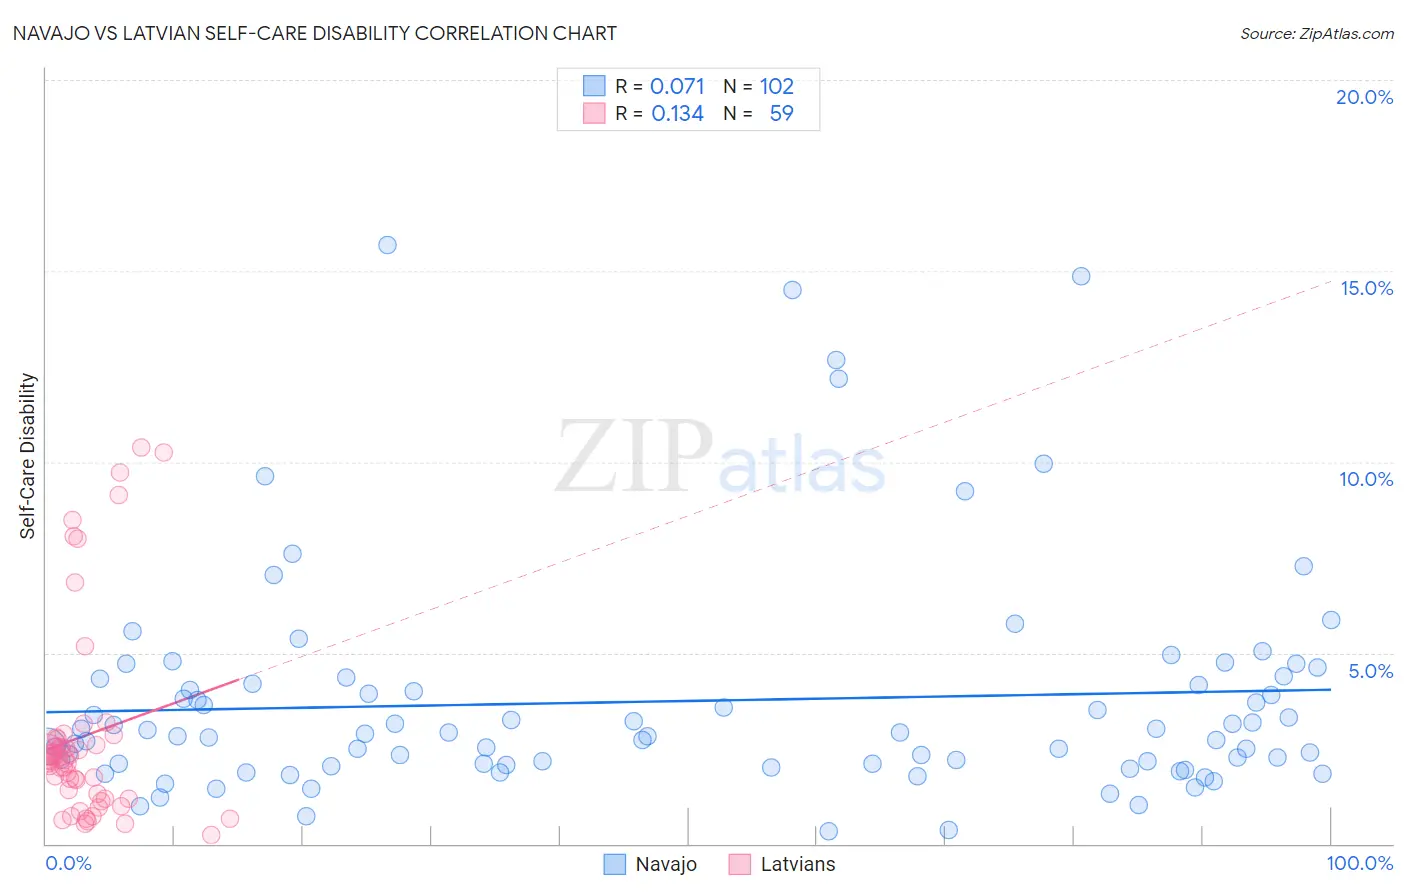
Navajo vs Latvian Self-Care Disability Correlation Chart
The statistical analysis conducted on geographies consisting of 224,543,915 people shows a slight positive correlation between the proportion of Navajo and percentage of population with self-care disability in the United States with a correlation coefficient (R) of 0.071 and weighted average of 2.9%. Similarly, the statistical analysis conducted on geographies consisting of 220,536,730 people shows a poor positive correlation between the proportion of Latvians and percentage of population with self-care disability in the United States with a correlation coefficient (R) of 0.134 and weighted average of 2.3%, a difference of 24.7%.
Self-Care Disability Correlation Summary
| Measurement | Navajo | Latvian |
| Minimum | 0.33% | 0.23% |
| Maximum | 15.7% | 10.4% |
| Range | 15.4% | 10.1% |
| Mean | 3.7% | 2.8% |
| Median | 2.9% | 2.2% |
| Interquartile 25% (IQ1) | 2.1% | 1.2% |
| Interquartile 75% (IQ3) | 4.2% | 2.8% |
| Interquartile Range (IQR) | 2.1% | 1.6% |
| Standard Deviation (Sample) | 3.0% | 2.6% |
| Standard Deviation (Population) | 2.9% | 2.6% |
Similar Demographics by Self-Care Disability
Demographics Similar to Navajo by Self-Care Disability
In terms of self-care disability, the demographic groups most similar to Navajo are Chickasaw (2.9%, a difference of 0.15%), Comanche (2.9%, a difference of 0.32%), Spanish American Indian (2.9%, a difference of 0.37%), Seminole (2.9%, a difference of 0.45%), and Assyrian/Chaldean/Syriac (2.8%, a difference of 0.52%).
| Demographics | Rating | Rank | Self-Care Disability |
| Creek | 0.0 /100 | #314 | Tragic 2.8% |
| Immigrants | Cuba | 0.0 /100 | #315 | Tragic 2.8% |
| Menominee | 0.0 /100 | #316 | Tragic 2.8% |
| Immigrants | Dominica | 0.0 /100 | #317 | Tragic 2.8% |
| Assyrians/Chaldeans/Syriacs | 0.0 /100 | #318 | Tragic 2.8% |
| Spanish American Indians | 0.0 /100 | #319 | Tragic 2.9% |
| Chickasaw | 0.0 /100 | #320 | Tragic 2.9% |
| Navajo | 0.0 /100 | #321 | Tragic 2.9% |
| Comanche | 0.0 /100 | #322 | Tragic 2.9% |
| Seminole | 0.0 /100 | #323 | Tragic 2.9% |
| Cherokee | 0.0 /100 | #324 | Tragic 2.9% |
| Immigrants | Uzbekistan | 0.0 /100 | #325 | Tragic 2.9% |
| Paiute | 0.0 /100 | #326 | Tragic 2.9% |
| Blacks/African Americans | 0.0 /100 | #327 | Tragic 2.9% |
| Hopi | 0.0 /100 | #328 | Tragic 2.9% |
Demographics Similar to Latvians by Self-Care Disability
In terms of self-care disability, the demographic groups most similar to Latvians are Immigrants from Brazil (2.3%, a difference of 0.020%), Immigrants from Malaysia (2.3%, a difference of 0.17%), Kenyan (2.3%, a difference of 0.17%), Immigrants from Serbia (2.3%, a difference of 0.19%), and Jordanian (2.3%, a difference of 0.22%).
| Demographics | Rating | Rank | Self-Care Disability |
| Immigrants | Uganda | 99.8 /100 | #42 | Exceptional 2.3% |
| Immigrants | Pakistan | 99.8 /100 | #43 | Exceptional 2.3% |
| Immigrants | South Africa | 99.8 /100 | #44 | Exceptional 2.3% |
| Norwegians | 99.8 /100 | #45 | Exceptional 2.3% |
| Czechs | 99.8 /100 | #46 | Exceptional 2.3% |
| Jordanians | 99.7 /100 | #47 | Exceptional 2.3% |
| Immigrants | Malaysia | 99.7 /100 | #48 | Exceptional 2.3% |
| Latvians | 99.7 /100 | #49 | Exceptional 2.3% |
| Immigrants | Brazil | 99.7 /100 | #50 | Exceptional 2.3% |
| Kenyans | 99.7 /100 | #51 | Exceptional 2.3% |
| Immigrants | Serbia | 99.6 /100 | #52 | Exceptional 2.3% |
| Australians | 99.6 /100 | #53 | Exceptional 2.3% |
| Argentineans | 99.6 /100 | #54 | Exceptional 2.3% |
| Immigrants | France | 99.6 /100 | #55 | Exceptional 2.3% |
| Immigrants | Eastern Asia | 99.6 /100 | #56 | Exceptional 2.3% |