Navajo vs Immigrants from Turkey Self-Care Disability
COMPARE
Navajo
Immigrants from Turkey
Self-Care Disability
Self-Care Disability Comparison
Navajo
Immigrants from Turkey
2.9%
SELF-CARE DISABILITY
0.0/ 100
METRIC RATING
321st/ 347
METRIC RANK
2.3%
SELF-CARE DISABILITY
99.9/ 100
METRIC RATING
34th/ 347
METRIC RANK
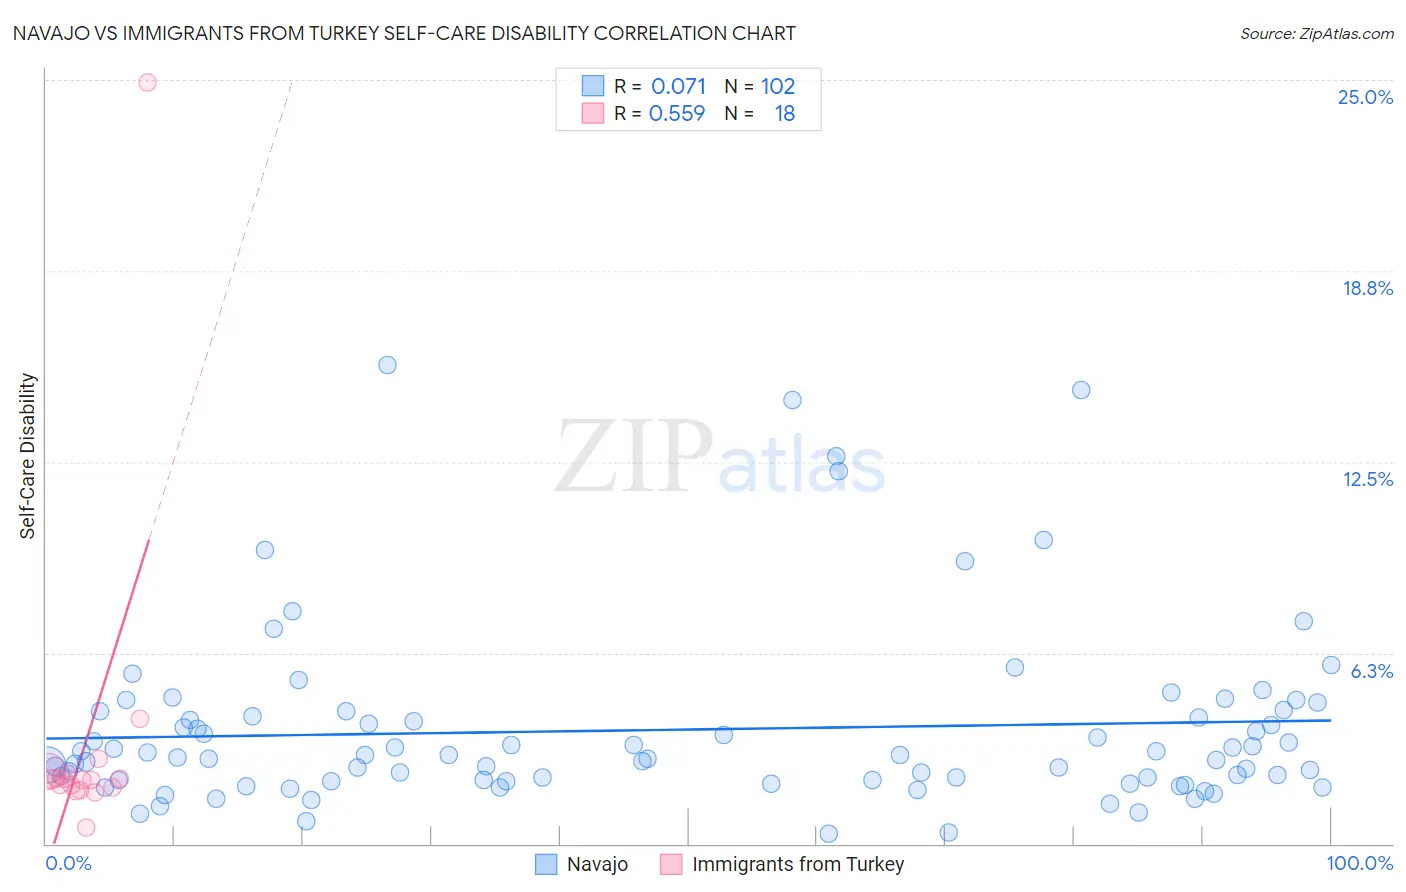
Navajo vs Immigrants from Turkey Self-Care Disability Correlation Chart
The statistical analysis conducted on geographies consisting of 224,543,915 people shows a slight positive correlation between the proportion of Navajo and percentage of population with self-care disability in the United States with a correlation coefficient (R) of 0.071 and weighted average of 2.9%. Similarly, the statistical analysis conducted on geographies consisting of 222,915,047 people shows a substantial positive correlation between the proportion of Immigrants from Turkey and percentage of population with self-care disability in the United States with a correlation coefficient (R) of 0.559 and weighted average of 2.3%, a difference of 26.4%.
Self-Care Disability Correlation Summary
| Measurement | Navajo | Immigrants from Turkey |
| Minimum | 0.33% | 0.52% |
| Maximum | 15.7% | 24.9% |
| Range | 15.4% | 24.4% |
| Mean | 3.7% | 3.4% |
| Median | 2.9% | 2.1% |
| Interquartile 25% (IQ1) | 2.1% | 1.8% |
| Interquartile 75% (IQ3) | 4.2% | 2.3% |
| Interquartile Range (IQR) | 2.1% | 0.47% |
| Standard Deviation (Sample) | 3.0% | 5.4% |
| Standard Deviation (Population) | 2.9% | 5.3% |
Similar Demographics by Self-Care Disability
Demographics Similar to Navajo by Self-Care Disability
In terms of self-care disability, the demographic groups most similar to Navajo are Chickasaw (2.9%, a difference of 0.15%), Comanche (2.9%, a difference of 0.32%), Spanish American Indian (2.9%, a difference of 0.37%), Seminole (2.9%, a difference of 0.45%), and Assyrian/Chaldean/Syriac (2.8%, a difference of 0.52%).
| Demographics | Rating | Rank | Self-Care Disability |
| Creek | 0.0 /100 | #314 | Tragic 2.8% |
| Immigrants | Cuba | 0.0 /100 | #315 | Tragic 2.8% |
| Menominee | 0.0 /100 | #316 | Tragic 2.8% |
| Immigrants | Dominica | 0.0 /100 | #317 | Tragic 2.8% |
| Assyrians/Chaldeans/Syriacs | 0.0 /100 | #318 | Tragic 2.8% |
| Spanish American Indians | 0.0 /100 | #319 | Tragic 2.9% |
| Chickasaw | 0.0 /100 | #320 | Tragic 2.9% |
| Navajo | 0.0 /100 | #321 | Tragic 2.9% |
| Comanche | 0.0 /100 | #322 | Tragic 2.9% |
| Seminole | 0.0 /100 | #323 | Tragic 2.9% |
| Cherokee | 0.0 /100 | #324 | Tragic 2.9% |
| Immigrants | Uzbekistan | 0.0 /100 | #325 | Tragic 2.9% |
| Paiute | 0.0 /100 | #326 | Tragic 2.9% |
| Blacks/African Americans | 0.0 /100 | #327 | Tragic 2.9% |
| Hopi | 0.0 /100 | #328 | Tragic 2.9% |
Demographics Similar to Immigrants from Turkey by Self-Care Disability
In terms of self-care disability, the demographic groups most similar to Immigrants from Turkey are Immigrants from Korea (2.3%, a difference of 0.060%), Immigrants from Australia (2.3%, a difference of 0.060%), Immigrants from Lithuania (2.3%, a difference of 0.070%), Immigrants from Sweden (2.3%, a difference of 0.24%), and Burmese (2.3%, a difference of 0.29%).
| Demographics | Rating | Rank | Self-Care Disability |
| Venezuelans | 99.9 /100 | #27 | Exceptional 2.2% |
| Inupiat | 99.9 /100 | #28 | Exceptional 2.2% |
| Immigrants | Zimbabwe | 99.9 /100 | #29 | Exceptional 2.3% |
| Paraguayans | 99.9 /100 | #30 | Exceptional 2.3% |
| Danes | 99.9 /100 | #31 | Exceptional 2.3% |
| Burmese | 99.9 /100 | #32 | Exceptional 2.3% |
| Immigrants | Korea | 99.9 /100 | #33 | Exceptional 2.3% |
| Immigrants | Turkey | 99.9 /100 | #34 | Exceptional 2.3% |
| Immigrants | Australia | 99.9 /100 | #35 | Exceptional 2.3% |
| Immigrants | Lithuania | 99.9 /100 | #36 | Exceptional 2.3% |
| Immigrants | Sweden | 99.9 /100 | #37 | Exceptional 2.3% |
| Immigrants | Eastern Africa | 99.9 /100 | #38 | Exceptional 2.3% |
| Immigrants | Bulgaria | 99.8 /100 | #39 | Exceptional 2.3% |
| Iranians | 99.8 /100 | #40 | Exceptional 2.3% |
| Immigrants | Sudan | 99.8 /100 | #41 | Exceptional 2.3% |