Immigrants from Venezuela vs French Canadian Male Disability
COMPARE
Immigrants from Venezuela
French Canadian
Male Disability
Male Disability Comparison
Immigrants from Venezuela
French Canadians
10.0%
MALE DISABILITY
100.0/ 100
METRIC RATING
22nd/ 347
METRIC RANK
13.3%
MALE DISABILITY
0.0/ 100
METRIC RATING
305th/ 347
METRIC RANK
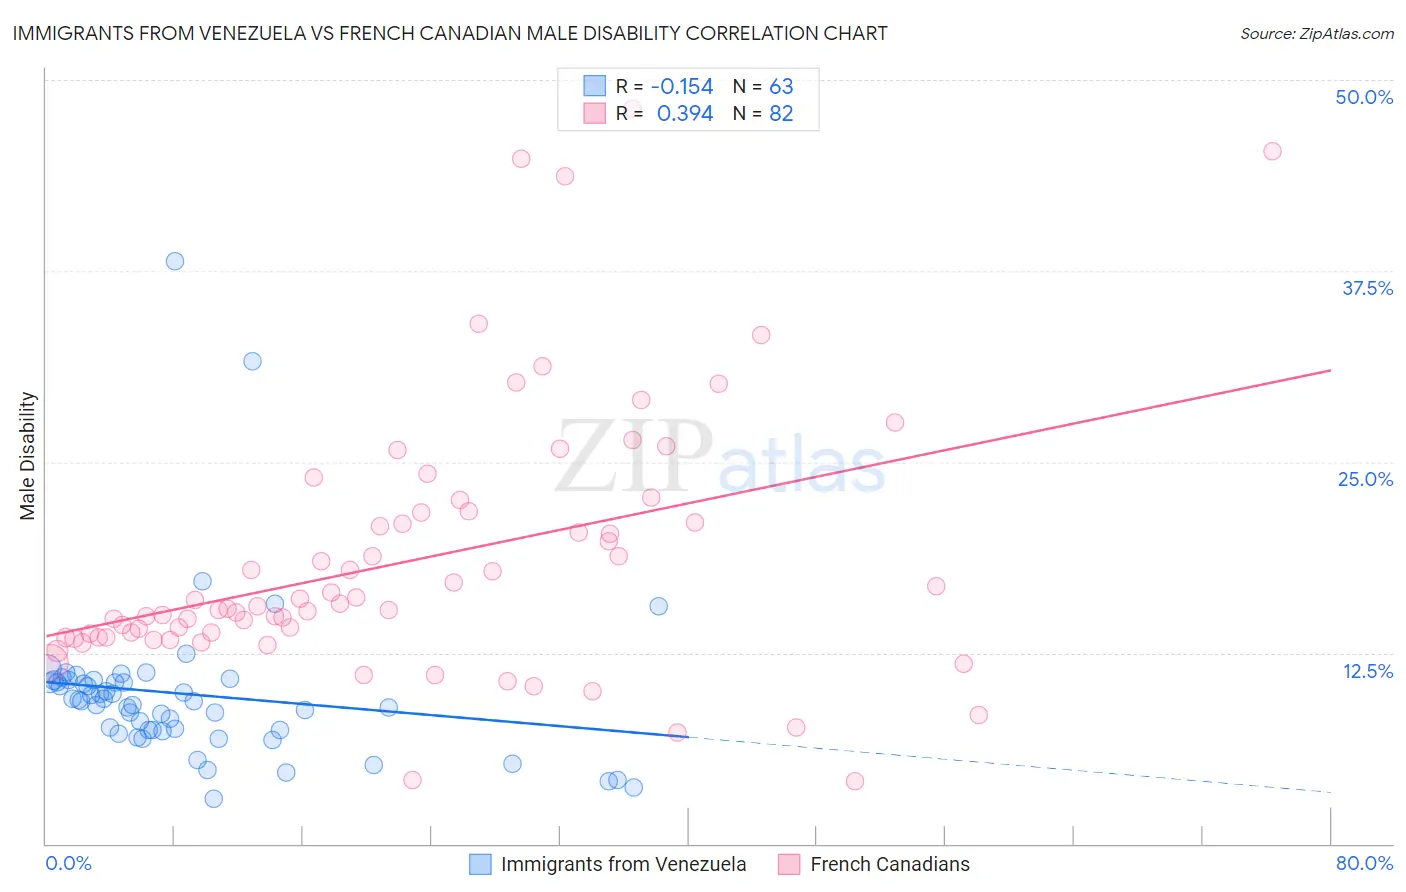
Immigrants from Venezuela vs French Canadian Male Disability Correlation Chart
The statistical analysis conducted on geographies consisting of 287,855,210 people shows a poor negative correlation between the proportion of Immigrants from Venezuela and percentage of males with a disability in the United States with a correlation coefficient (R) of -0.154 and weighted average of 10.0%. Similarly, the statistical analysis conducted on geographies consisting of 502,511,439 people shows a mild positive correlation between the proportion of French Canadians and percentage of males with a disability in the United States with a correlation coefficient (R) of 0.394 and weighted average of 13.3%, a difference of 32.8%.
Male Disability Correlation Summary
| Measurement | Immigrants from Venezuela | French Canadian |
| Minimum | 2.9% | 4.1% |
| Maximum | 38.1% | 48.1% |
| Range | 35.2% | 44.0% |
| Mean | 9.8% | 18.5% |
| Median | 9.3% | 15.5% |
| Interquartile 25% (IQ1) | 7.4% | 13.5% |
| Interquartile 75% (IQ3) | 10.7% | 21.7% |
| Interquartile Range (IQR) | 3.2% | 8.2% |
| Standard Deviation (Sample) | 5.3% | 8.7% |
| Standard Deviation (Population) | 5.3% | 8.7% |
Similar Demographics by Male Disability
Demographics Similar to Immigrants from Venezuela by Male Disability
In terms of male disability, the demographic groups most similar to Immigrants from Venezuela are Cypriot (10.0%, a difference of 0.090%), Immigrants from Asia (10.0%, a difference of 0.23%), Burmese (10.0%, a difference of 0.29%), Asian (10.0%, a difference of 0.39%), and Immigrants from Malaysia (10.0%, a difference of 0.41%).
| Demographics | Rating | Rank | Male Disability |
| Indians (Asian) | 100.0 /100 | #15 | Exceptional 9.7% |
| Okinawans | 100.0 /100 | #16 | Exceptional 9.8% |
| Immigrants | Korea | 100.0 /100 | #17 | Exceptional 9.8% |
| Immigrants | Pakistan | 100.0 /100 | #18 | Exceptional 9.8% |
| Immigrants | Sri Lanka | 100.0 /100 | #19 | Exceptional 10.0% |
| Asians | 100.0 /100 | #20 | Exceptional 10.0% |
| Burmese | 100.0 /100 | #21 | Exceptional 10.0% |
| Immigrants | Venezuela | 100.0 /100 | #22 | Exceptional 10.0% |
| Cypriots | 100.0 /100 | #23 | Exceptional 10.0% |
| Immigrants | Asia | 100.0 /100 | #24 | Exceptional 10.0% |
| Immigrants | Malaysia | 99.9 /100 | #25 | Exceptional 10.0% |
| Paraguayans | 99.9 /100 | #26 | Exceptional 10.1% |
| Egyptians | 99.9 /100 | #27 | Exceptional 10.1% |
| Vietnamese | 99.9 /100 | #28 | Exceptional 10.1% |
| Venezuelans | 99.9 /100 | #29 | Exceptional 10.1% |
Demographics Similar to French Canadians by Male Disability
In terms of male disability, the demographic groups most similar to French Canadians are Spanish American (13.3%, a difference of 0.20%), Black/African American (13.2%, a difference of 0.41%), Arapaho (13.3%, a difference of 0.42%), French American Indian (13.4%, a difference of 0.58%), and Scotch-Irish (13.2%, a difference of 0.74%).
| Demographics | Rating | Rank | Male Disability |
| Pennsylvania Germans | 0.0 /100 | #298 | Tragic 13.0% |
| Celtics | 0.0 /100 | #299 | Tragic 13.0% |
| Cheyenne | 0.0 /100 | #300 | Tragic 13.0% |
| French | 0.0 /100 | #301 | Tragic 13.0% |
| Crow | 0.0 /100 | #302 | Tragic 13.1% |
| Scotch-Irish | 0.0 /100 | #303 | Tragic 13.2% |
| Blacks/African Americans | 0.0 /100 | #304 | Tragic 13.2% |
| French Canadians | 0.0 /100 | #305 | Tragic 13.3% |
| Spanish Americans | 0.0 /100 | #306 | Tragic 13.3% |
| Arapaho | 0.0 /100 | #307 | Tragic 13.3% |
| French American Indians | 0.0 /100 | #308 | Tragic 13.4% |
| Blackfeet | 0.0 /100 | #309 | Tragic 13.4% |
| Immigrants | Azores | 0.0 /100 | #310 | Tragic 13.4% |
| Delaware | 0.0 /100 | #311 | Tragic 13.5% |
| Yakama | 0.0 /100 | #312 | Tragic 13.5% |