Slavic vs Immigrants from Canada Cognitive Disability
COMPARE
Slavic
Immigrants from Canada
Cognitive Disability
Cognitive Disability Comparison
Slavs
Immigrants from Canada
16.7%
COGNITIVE DISABILITY
99.3/ 100
METRIC RATING
74th/ 347
METRIC RANK
16.5%
COGNITIVE DISABILITY
99.8/ 100
METRIC RATING
43rd/ 347
METRIC RANK
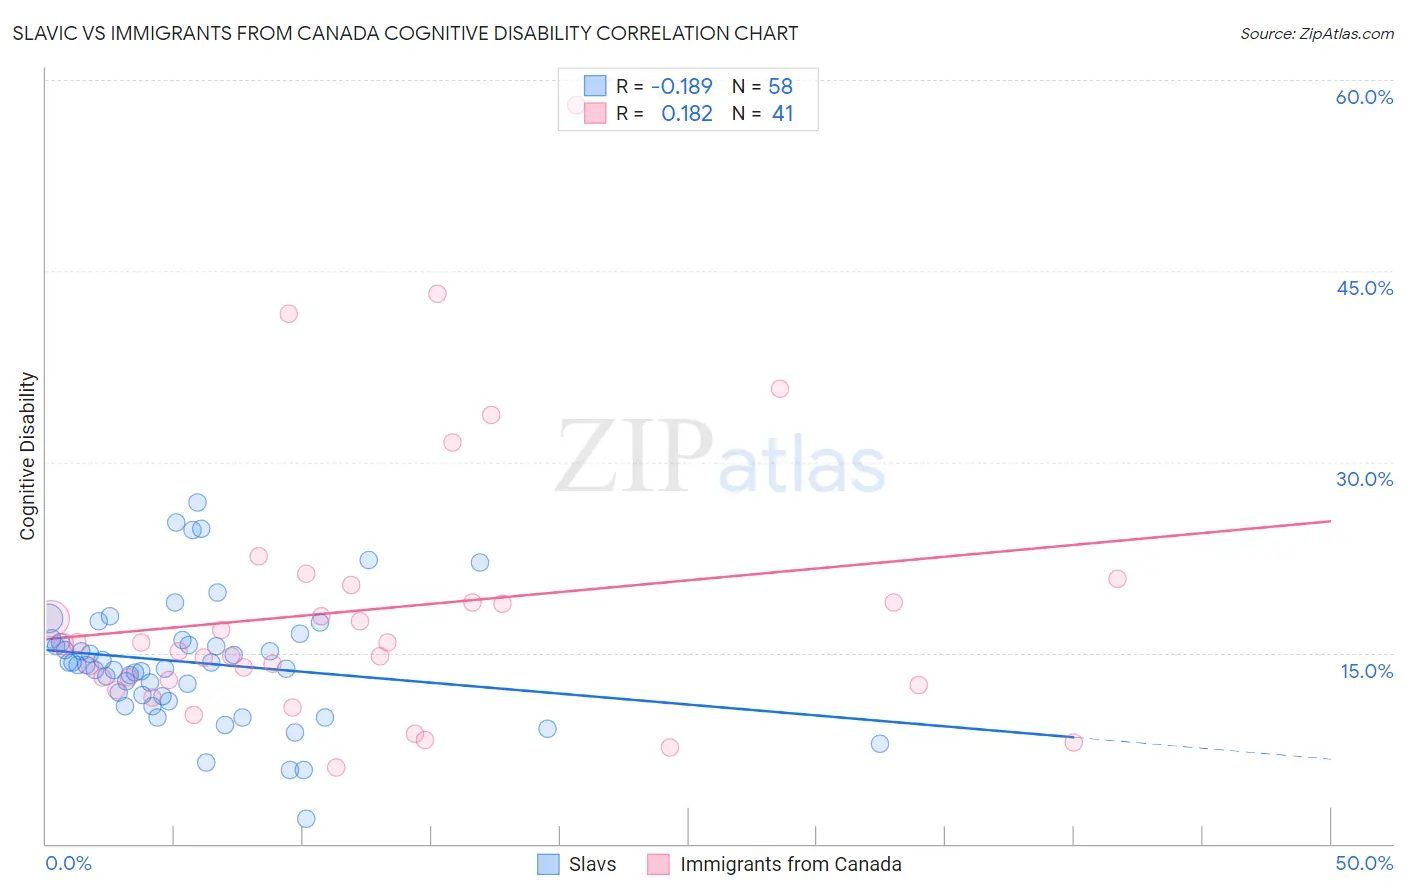
Slavic vs Immigrants from Canada Cognitive Disability Correlation Chart
The statistical analysis conducted on geographies consisting of 270,861,069 people shows a poor negative correlation between the proportion of Slavs and percentage of population with cognitive disability in the United States with a correlation coefficient (R) of -0.189 and weighted average of 16.7%. Similarly, the statistical analysis conducted on geographies consisting of 459,370,833 people shows a poor positive correlation between the proportion of Immigrants from Canada and percentage of population with cognitive disability in the United States with a correlation coefficient (R) of 0.182 and weighted average of 16.5%, a difference of 1.1%.
Cognitive Disability Correlation Summary
| Measurement | Slavic | Immigrants from Canada |
| Minimum | 1.9% | 6.0% |
| Maximum | 26.8% | 58.1% |
| Range | 24.9% | 52.1% |
| Mean | 14.2% | 18.4% |
| Median | 14.0% | 15.7% |
| Interquartile 25% (IQ1) | 11.6% | 12.7% |
| Interquartile 75% (IQ3) | 16.0% | 19.7% |
| Interquartile Range (IQR) | 4.4% | 7.0% |
| Standard Deviation (Sample) | 4.9% | 10.6% |
| Standard Deviation (Population) | 4.8% | 10.5% |
Similar Demographics by Cognitive Disability
Demographics Similar to Slavs by Cognitive Disability
In terms of cognitive disability, the demographic groups most similar to Slavs are Burmese (16.7%, a difference of 0.0%), German (16.7%, a difference of 0.010%), Estonian (16.7%, a difference of 0.010%), Immigrants from Sweden (16.7%, a difference of 0.030%), and Immigrants from Belgium (16.7%, a difference of 0.030%).
| Demographics | Rating | Rank | Cognitive Disability |
| Latvians | 99.5 /100 | #67 | Exceptional 16.6% |
| Ukrainians | 99.4 /100 | #68 | Exceptional 16.6% |
| Immigrants | Uzbekistan | 99.4 /100 | #69 | Exceptional 16.7% |
| Immigrants | Sweden | 99.4 /100 | #70 | Exceptional 16.7% |
| Immigrants | Belgium | 99.3 /100 | #71 | Exceptional 16.7% |
| Germans | 99.3 /100 | #72 | Exceptional 16.7% |
| Burmese | 99.3 /100 | #73 | Exceptional 16.7% |
| Slavs | 99.3 /100 | #74 | Exceptional 16.7% |
| Estonians | 99.3 /100 | #75 | Exceptional 16.7% |
| Immigrants | Serbia | 99.3 /100 | #76 | Exceptional 16.7% |
| Immigrants | Hungary | 99.3 /100 | #77 | Exceptional 16.7% |
| Peruvians | 99.3 /100 | #78 | Exceptional 16.7% |
| Immigrants | Bulgaria | 99.3 /100 | #79 | Exceptional 16.7% |
| Egyptians | 99.2 /100 | #80 | Exceptional 16.7% |
| Immigrants | Netherlands | 99.2 /100 | #81 | Exceptional 16.7% |
Demographics Similar to Immigrants from Canada by Cognitive Disability
In terms of cognitive disability, the demographic groups most similar to Immigrants from Canada are Macedonian (16.5%, a difference of 0.030%), Immigrants from Europe (16.5%, a difference of 0.030%), Immigrants from Colombia (16.5%, a difference of 0.050%), Hungarian (16.5%, a difference of 0.060%), and Immigrants from Italy (16.5%, a difference of 0.070%).
| Demographics | Rating | Rank | Cognitive Disability |
| Greeks | 99.9 /100 | #36 | Exceptional 16.4% |
| Slovenes | 99.9 /100 | #37 | Exceptional 16.5% |
| Immigrants | Eastern Europe | 99.9 /100 | #38 | Exceptional 16.5% |
| Bolivians | 99.9 /100 | #39 | Exceptional 16.5% |
| Immigrants | Belarus | 99.9 /100 | #40 | Exceptional 16.5% |
| Cubans | 99.9 /100 | #41 | Exceptional 16.5% |
| Hungarians | 99.9 /100 | #42 | Exceptional 16.5% |
| Immigrants | Canada | 99.8 /100 | #43 | Exceptional 16.5% |
| Macedonians | 99.8 /100 | #44 | Exceptional 16.5% |
| Immigrants | Europe | 99.8 /100 | #45 | Exceptional 16.5% |
| Immigrants | Colombia | 99.8 /100 | #46 | Exceptional 16.5% |
| Immigrants | Italy | 99.8 /100 | #47 | Exceptional 16.5% |
| Immigrants | North America | 99.8 /100 | #48 | Exceptional 16.5% |
| Iranians | 99.8 /100 | #49 | Exceptional 16.5% |
| Norwegians | 99.8 /100 | #50 | Exceptional 16.5% |