Native/Alaskan vs Spanish Cognitive Disability
COMPARE
Native/Alaskan
Spanish
Cognitive Disability
Cognitive Disability Comparison
Natives/Alaskans
Spanish
18.1%
COGNITIVE DISABILITY
0.1/ 100
METRIC RATING
289th/ 347
METRIC RANK
17.3%
COGNITIVE DISABILITY
48.9/ 100
METRIC RATING
178th/ 347
METRIC RANK
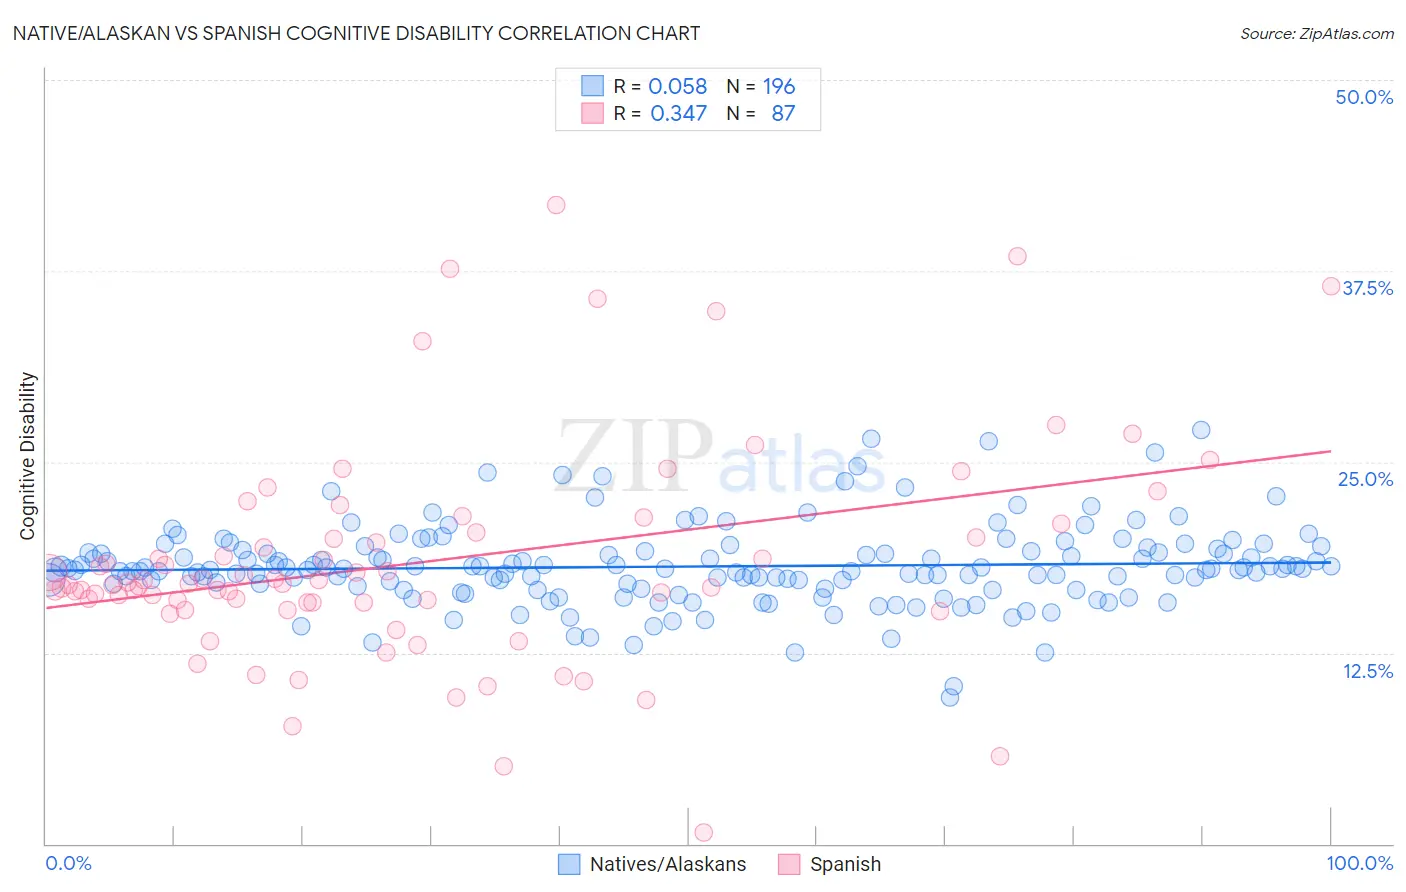
Native/Alaskan vs Spanish Cognitive Disability Correlation Chart
The statistical analysis conducted on geographies consisting of 512,906,873 people shows a slight positive correlation between the proportion of Natives/Alaskans and percentage of population with cognitive disability in the United States with a correlation coefficient (R) of 0.058 and weighted average of 18.1%. Similarly, the statistical analysis conducted on geographies consisting of 422,108,205 people shows a mild positive correlation between the proportion of Spanish and percentage of population with cognitive disability in the United States with a correlation coefficient (R) of 0.347 and weighted average of 17.3%, a difference of 5.0%.
Cognitive Disability Correlation Summary
| Measurement | Native/Alaskan | Spanish |
| Minimum | 9.6% | 0.76% |
| Maximum | 27.1% | 41.8% |
| Range | 17.4% | 41.1% |
| Mean | 18.1% | 18.4% |
| Median | 18.0% | 17.0% |
| Interquartile 25% (IQ1) | 16.9% | 15.8% |
| Interquartile 75% (IQ3) | 19.2% | 20.4% |
| Interquartile Range (IQR) | 2.2% | 4.6% |
| Standard Deviation (Sample) | 2.6% | 7.2% |
| Standard Deviation (Population) | 2.6% | 7.2% |
Similar Demographics by Cognitive Disability
Demographics Similar to Natives/Alaskans by Cognitive Disability
In terms of cognitive disability, the demographic groups most similar to Natives/Alaskans are Immigrants from West Indies (18.1%, a difference of 0.010%), Dutch West Indian (18.1%, a difference of 0.020%), Immigrants from Africa (18.1%, a difference of 0.030%), Kenyan (18.1%, a difference of 0.060%), and Bermudan (18.1%, a difference of 0.10%).
| Demographics | Rating | Rank | Cognitive Disability |
| Immigrants | Cambodia | 0.1 /100 | #282 | Tragic 18.1% |
| Nigerians | 0.1 /100 | #283 | Tragic 18.1% |
| Immigrants | Uganda | 0.1 /100 | #284 | Tragic 18.1% |
| Bermudans | 0.1 /100 | #285 | Tragic 18.1% |
| Kenyans | 0.1 /100 | #286 | Tragic 18.1% |
| Dutch West Indians | 0.1 /100 | #287 | Tragic 18.1% |
| Immigrants | West Indies | 0.1 /100 | #288 | Tragic 18.1% |
| Natives/Alaskans | 0.1 /100 | #289 | Tragic 18.1% |
| Immigrants | Africa | 0.1 /100 | #290 | Tragic 18.1% |
| Ottawa | 0.1 /100 | #291 | Tragic 18.2% |
| Iroquois | 0.1 /100 | #292 | Tragic 18.2% |
| Central American Indians | 0.1 /100 | #293 | Tragic 18.2% |
| British West Indians | 0.1 /100 | #294 | Tragic 18.2% |
| German Russians | 0.0 /100 | #295 | Tragic 18.2% |
| Immigrants | Burma/Myanmar | 0.0 /100 | #296 | Tragic 18.2% |
Demographics Similar to Spanish by Cognitive Disability
In terms of cognitive disability, the demographic groups most similar to Spanish are Ute (17.3%, a difference of 0.0%), Shoshone (17.3%, a difference of 0.010%), Sioux (17.3%, a difference of 0.010%), Tsimshian (17.3%, a difference of 0.020%), and Laotian (17.3%, a difference of 0.030%).
| Demographics | Rating | Rank | Cognitive Disability |
| Tlingit-Haida | 59.4 /100 | #171 | Average 17.2% |
| Immigrants | Turkey | 56.7 /100 | #172 | Average 17.2% |
| Immigrants | Northern Africa | 50.2 /100 | #173 | Average 17.3% |
| Laotians | 50.0 /100 | #174 | Average 17.3% |
| Tsimshian | 49.8 /100 | #175 | Average 17.3% |
| Shoshone | 49.2 /100 | #176 | Average 17.3% |
| Ute | 49.1 /100 | #177 | Average 17.3% |
| Spanish | 48.9 /100 | #178 | Average 17.3% |
| Sioux | 48.6 /100 | #179 | Average 17.3% |
| Pakistanis | 43.9 /100 | #180 | Average 17.3% |
| Immigrants | Guyana | 42.9 /100 | #181 | Average 17.3% |
| Arabs | 42.8 /100 | #182 | Average 17.3% |
| Spaniards | 40.3 /100 | #183 | Average 17.3% |
| Crow | 39.1 /100 | #184 | Fair 17.3% |
| Afghans | 38.2 /100 | #185 | Fair 17.3% |