Native/Alaskan vs Pueblo Cognitive Disability
COMPARE
Native/Alaskan
Pueblo
Cognitive Disability
Cognitive Disability Comparison
Natives/Alaskans
Pueblo
18.1%
COGNITIVE DISABILITY
0.1/ 100
METRIC RATING
289th/ 347
METRIC RANK
18.7%
COGNITIVE DISABILITY
0.0/ 100
METRIC RATING
323rd/ 347
METRIC RANK
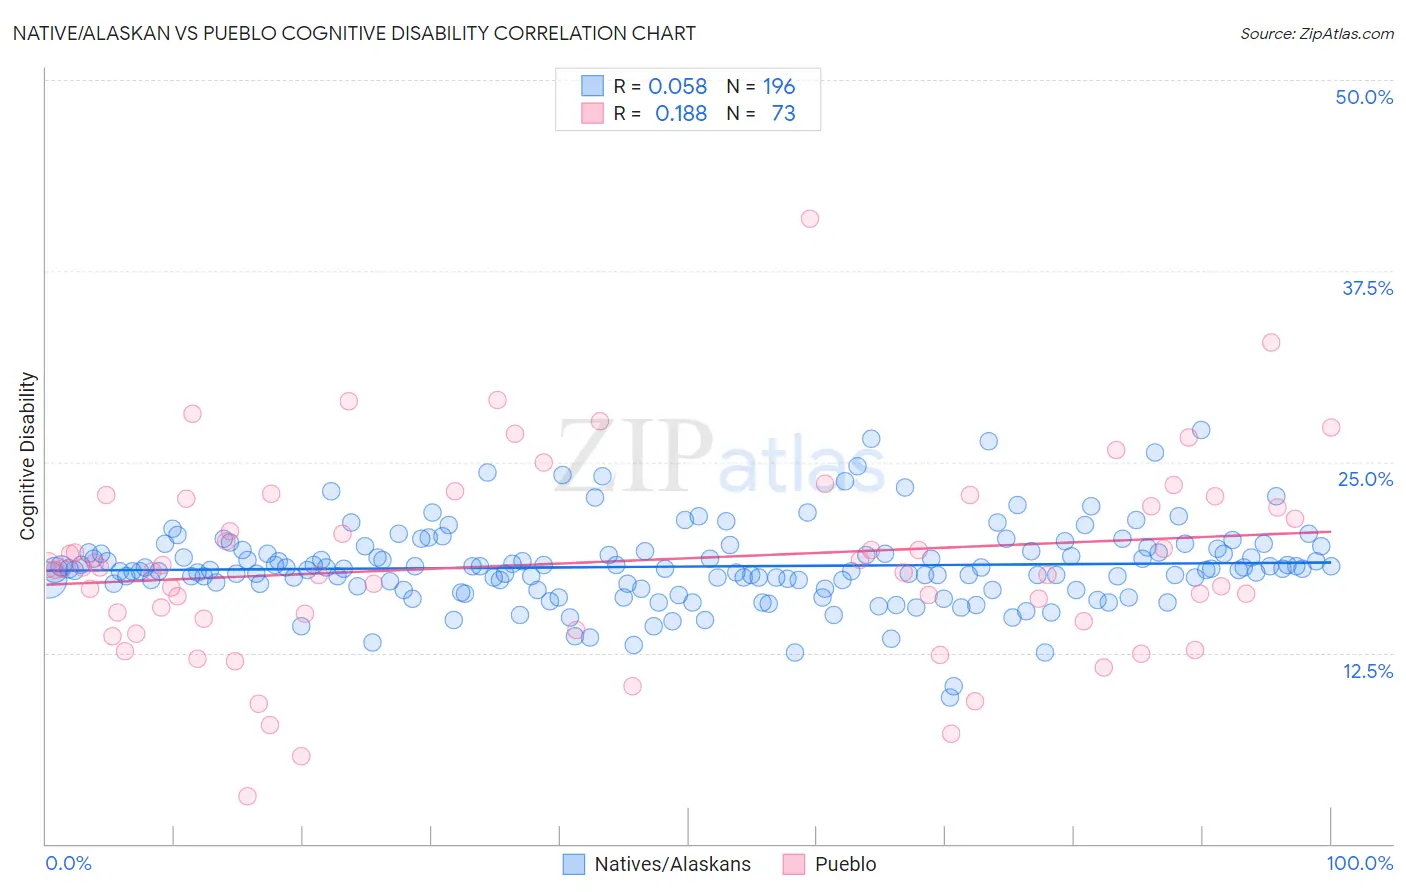
Native/Alaskan vs Pueblo Cognitive Disability Correlation Chart
The statistical analysis conducted on geographies consisting of 512,906,873 people shows a slight positive correlation between the proportion of Natives/Alaskans and percentage of population with cognitive disability in the United States with a correlation coefficient (R) of 0.058 and weighted average of 18.1%. Similarly, the statistical analysis conducted on geographies consisting of 120,078,702 people shows a poor positive correlation between the proportion of Pueblo and percentage of population with cognitive disability in the United States with a correlation coefficient (R) of 0.188 and weighted average of 18.7%, a difference of 2.8%.
Cognitive Disability Correlation Summary
| Measurement | Native/Alaskan | Pueblo |
| Minimum | 9.6% | 3.1% |
| Maximum | 27.1% | 40.9% |
| Range | 17.4% | 37.7% |
| Mean | 18.1% | 18.4% |
| Median | 18.0% | 18.0% |
| Interquartile 25% (IQ1) | 16.9% | 14.7% |
| Interquartile 75% (IQ3) | 19.2% | 22.7% |
| Interquartile Range (IQR) | 2.2% | 8.0% |
| Standard Deviation (Sample) | 2.6% | 6.4% |
| Standard Deviation (Population) | 2.6% | 6.3% |
Similar Demographics by Cognitive Disability
Demographics Similar to Natives/Alaskans by Cognitive Disability
In terms of cognitive disability, the demographic groups most similar to Natives/Alaskans are Immigrants from West Indies (18.1%, a difference of 0.010%), Dutch West Indian (18.1%, a difference of 0.020%), Immigrants from Africa (18.1%, a difference of 0.030%), Kenyan (18.1%, a difference of 0.060%), and Bermudan (18.1%, a difference of 0.10%).
| Demographics | Rating | Rank | Cognitive Disability |
| Immigrants | Cambodia | 0.1 /100 | #282 | Tragic 18.1% |
| Nigerians | 0.1 /100 | #283 | Tragic 18.1% |
| Immigrants | Uganda | 0.1 /100 | #284 | Tragic 18.1% |
| Bermudans | 0.1 /100 | #285 | Tragic 18.1% |
| Kenyans | 0.1 /100 | #286 | Tragic 18.1% |
| Dutch West Indians | 0.1 /100 | #287 | Tragic 18.1% |
| Immigrants | West Indies | 0.1 /100 | #288 | Tragic 18.1% |
| Natives/Alaskans | 0.1 /100 | #289 | Tragic 18.1% |
| Immigrants | Africa | 0.1 /100 | #290 | Tragic 18.1% |
| Ottawa | 0.1 /100 | #291 | Tragic 18.2% |
| Iroquois | 0.1 /100 | #292 | Tragic 18.2% |
| Central American Indians | 0.1 /100 | #293 | Tragic 18.2% |
| British West Indians | 0.1 /100 | #294 | Tragic 18.2% |
| German Russians | 0.0 /100 | #295 | Tragic 18.2% |
| Immigrants | Burma/Myanmar | 0.0 /100 | #296 | Tragic 18.2% |
Demographics Similar to Pueblo by Cognitive Disability
In terms of cognitive disability, the demographic groups most similar to Pueblo are Immigrants from Liberia (18.7%, a difference of 0.020%), African (18.6%, a difference of 0.080%), Dominican (18.7%, a difference of 0.12%), Apache (18.6%, a difference of 0.17%), and Indonesian (18.7%, a difference of 0.20%).
| Demographics | Rating | Rank | Cognitive Disability |
| Immigrants | Middle Africa | 0.0 /100 | #316 | Tragic 18.6% |
| Liberians | 0.0 /100 | #317 | Tragic 18.6% |
| Bangladeshis | 0.0 /100 | #318 | Tragic 18.6% |
| Comanche | 0.0 /100 | #319 | Tragic 18.6% |
| Apache | 0.0 /100 | #320 | Tragic 18.6% |
| Africans | 0.0 /100 | #321 | Tragic 18.6% |
| Immigrants | Liberia | 0.0 /100 | #322 | Tragic 18.7% |
| Pueblo | 0.0 /100 | #323 | Tragic 18.7% |
| Dominicans | 0.0 /100 | #324 | Tragic 18.7% |
| Indonesians | 0.0 /100 | #325 | Tragic 18.7% |
| Immigrants | Senegal | 0.0 /100 | #326 | Tragic 18.7% |
| U.S. Virgin Islanders | 0.0 /100 | #327 | Tragic 18.7% |
| Kiowa | 0.0 /100 | #328 | Tragic 18.7% |
| Navajo | 0.0 /100 | #329 | Tragic 18.8% |
| Immigrants | Dominican Republic | 0.0 /100 | #330 | Tragic 18.8% |