Czechoslovakian vs Immigrants from Canada Cognitive Disability
COMPARE
Czechoslovakian
Immigrants from Canada
Cognitive Disability
Cognitive Disability Comparison
Czechoslovakians
Immigrants from Canada
16.6%
COGNITIVE DISABILITY
99.6/ 100
METRIC RATING
62nd/ 347
METRIC RANK
16.5%
COGNITIVE DISABILITY
99.8/ 100
METRIC RATING
43rd/ 347
METRIC RANK
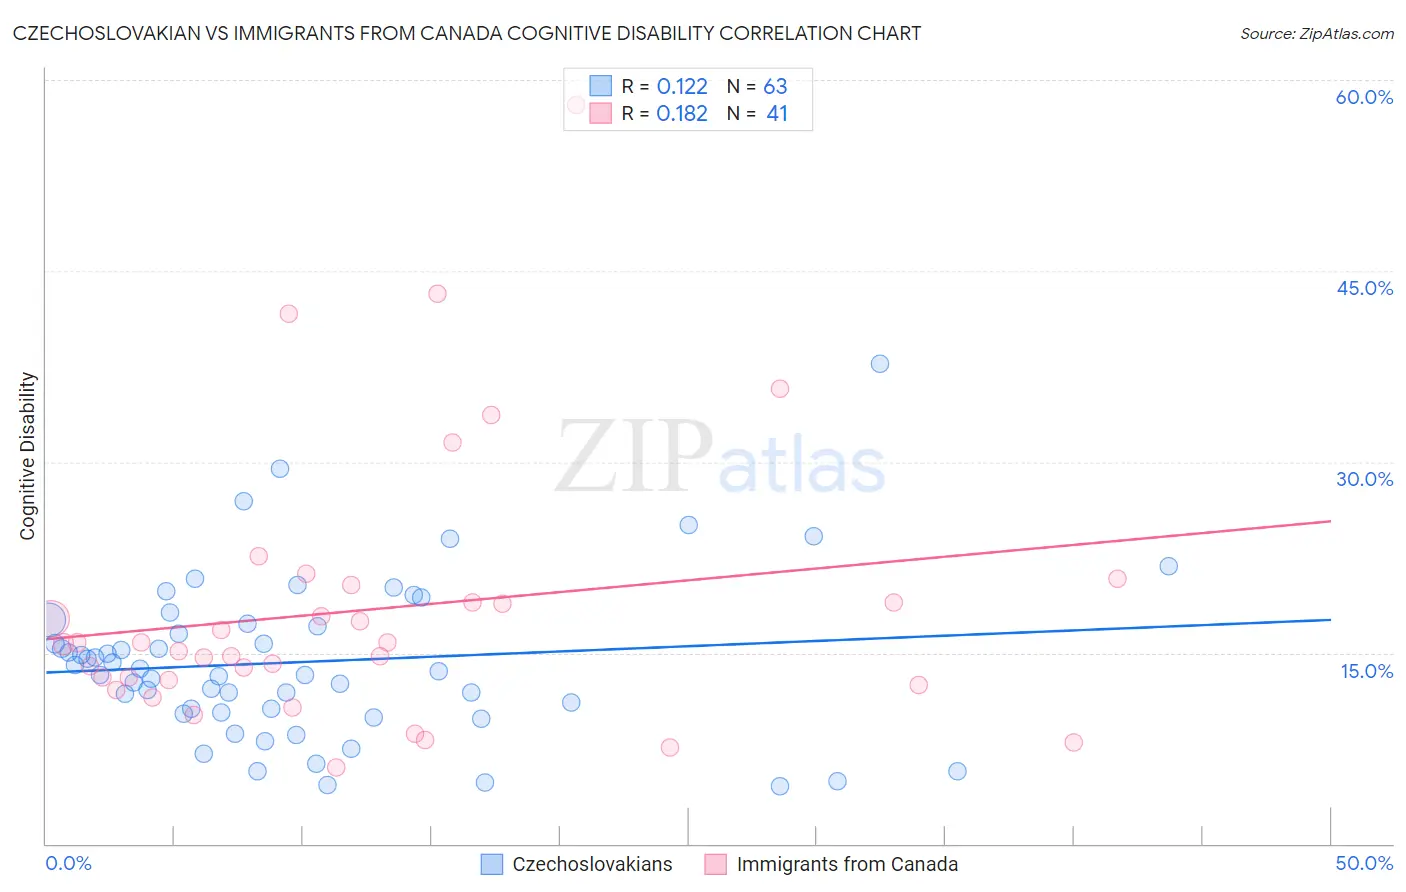
Czechoslovakian vs Immigrants from Canada Cognitive Disability Correlation Chart
The statistical analysis conducted on geographies consisting of 368,659,789 people shows a poor positive correlation between the proportion of Czechoslovakians and percentage of population with cognitive disability in the United States with a correlation coefficient (R) of 0.122 and weighted average of 16.6%. Similarly, the statistical analysis conducted on geographies consisting of 459,370,833 people shows a poor positive correlation between the proportion of Immigrants from Canada and percentage of population with cognitive disability in the United States with a correlation coefficient (R) of 0.182 and weighted average of 16.5%, a difference of 0.68%.
Cognitive Disability Correlation Summary
| Measurement | Czechoslovakian | Immigrants from Canada |
| Minimum | 4.6% | 6.0% |
| Maximum | 37.8% | 58.1% |
| Range | 33.2% | 52.1% |
| Mean | 14.3% | 18.4% |
| Median | 13.6% | 15.7% |
| Interquartile 25% (IQ1) | 10.4% | 12.7% |
| Interquartile 75% (IQ3) | 17.2% | 19.7% |
| Interquartile Range (IQR) | 6.9% | 7.0% |
| Standard Deviation (Sample) | 6.3% | 10.6% |
| Standard Deviation (Population) | 6.3% | 10.5% |
Demographics Similar to Czechoslovakians and Immigrants from Canada by Cognitive Disability
In terms of cognitive disability, the demographic groups most similar to Czechoslovakians are Immigrants from England (16.6%, a difference of 0.030%), Romanian (16.6%, a difference of 0.090%), Pennsylvania German (16.6%, a difference of 0.10%), Immigrants from Peru (16.6%, a difference of 0.10%), and Bhutanese (16.6%, a difference of 0.18%). Similarly, the demographic groups most similar to Immigrants from Canada are Macedonian (16.5%, a difference of 0.030%), Immigrants from Europe (16.5%, a difference of 0.030%), Immigrants from Colombia (16.5%, a difference of 0.050%), Hungarian (16.5%, a difference of 0.060%), and Immigrants from Italy (16.5%, a difference of 0.070%).
| Demographics | Rating | Rank | Cognitive Disability |
| Hungarians | 99.9 /100 | #42 | Exceptional 16.5% |
| Immigrants | Canada | 99.8 /100 | #43 | Exceptional 16.5% |
| Macedonians | 99.8 /100 | #44 | Exceptional 16.5% |
| Immigrants | Europe | 99.8 /100 | #45 | Exceptional 16.5% |
| Immigrants | Colombia | 99.8 /100 | #46 | Exceptional 16.5% |
| Immigrants | Italy | 99.8 /100 | #47 | Exceptional 16.5% |
| Immigrants | North America | 99.8 /100 | #48 | Exceptional 16.5% |
| Iranians | 99.8 /100 | #49 | Exceptional 16.5% |
| Norwegians | 99.8 /100 | #50 | Exceptional 16.5% |
| Immigrants | Korea | 99.8 /100 | #51 | Exceptional 16.5% |
| Soviet Union | 99.8 /100 | #52 | Exceptional 16.5% |
| Swedes | 99.8 /100 | #53 | Exceptional 16.5% |
| Immigrants | Iran | 99.8 /100 | #54 | Exceptional 16.5% |
| Immigrants | Venezuela | 99.7 /100 | #55 | Exceptional 16.5% |
| Austrians | 99.7 /100 | #56 | Exceptional 16.6% |
| Bhutanese | 99.7 /100 | #57 | Exceptional 16.6% |
| Pennsylvania Germans | 99.7 /100 | #58 | Exceptional 16.6% |
| Immigrants | Peru | 99.7 /100 | #59 | Exceptional 16.6% |
| Romanians | 99.7 /100 | #60 | Exceptional 16.6% |
| Immigrants | England | 99.6 /100 | #61 | Exceptional 16.6% |
| Czechoslovakians | 99.6 /100 | #62 | Exceptional 16.6% |