Barbadian vs Immigrants from Canada Cognitive Disability
COMPARE
Barbadian
Immigrants from Canada
Cognitive Disability
Cognitive Disability Comparison
Barbadians
Immigrants from Canada
18.3%
COGNITIVE DISABILITY
0.0/ 100
METRIC RATING
302nd/ 347
METRIC RANK
16.5%
COGNITIVE DISABILITY
99.8/ 100
METRIC RATING
43rd/ 347
METRIC RANK
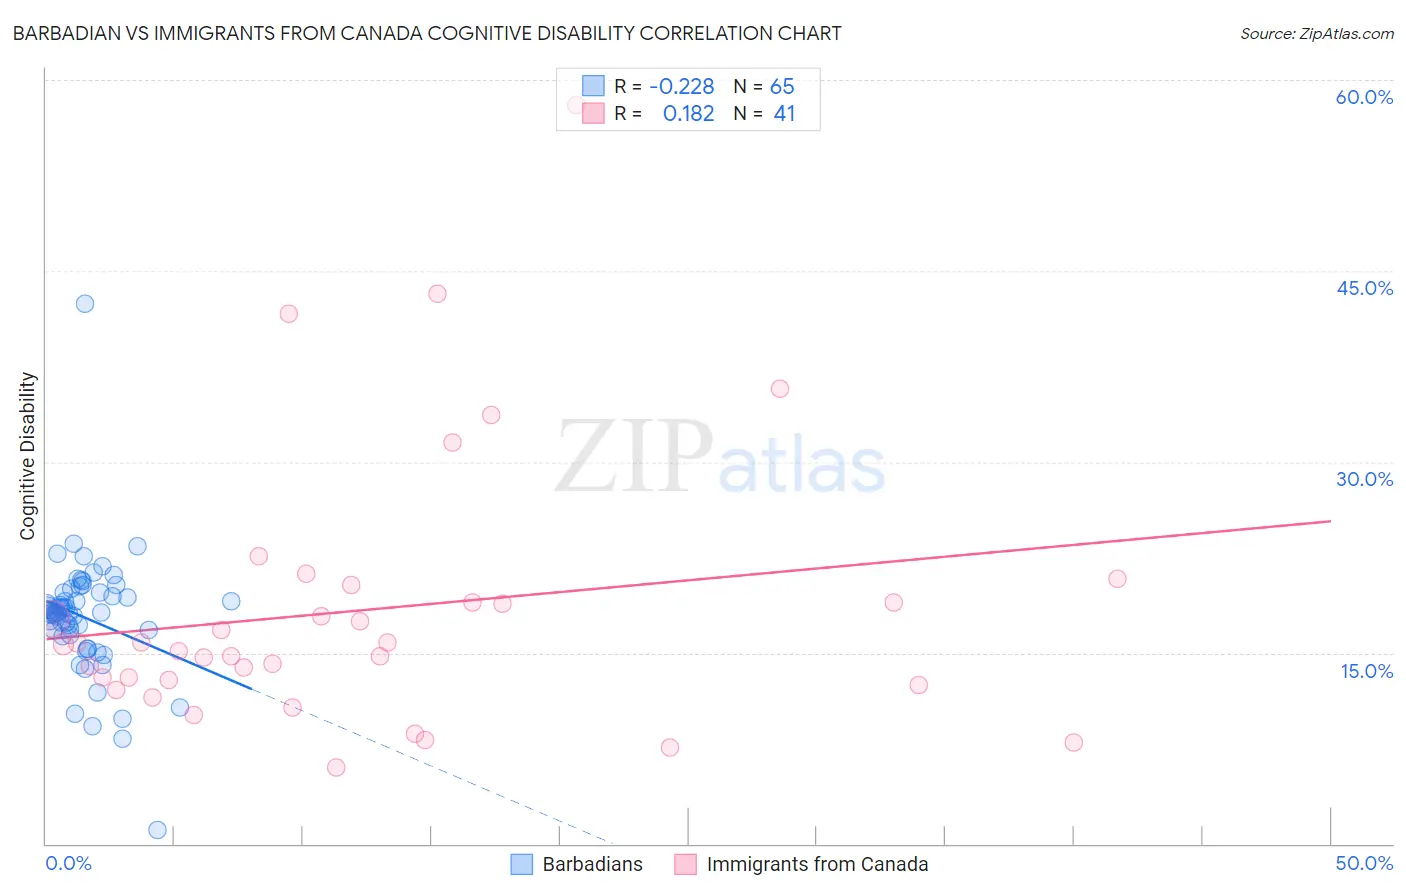
Barbadian vs Immigrants from Canada Cognitive Disability Correlation Chart
The statistical analysis conducted on geographies consisting of 141,302,702 people shows a weak negative correlation between the proportion of Barbadians and percentage of population with cognitive disability in the United States with a correlation coefficient (R) of -0.228 and weighted average of 18.3%. Similarly, the statistical analysis conducted on geographies consisting of 459,370,833 people shows a poor positive correlation between the proportion of Immigrants from Canada and percentage of population with cognitive disability in the United States with a correlation coefficient (R) of 0.182 and weighted average of 16.5%, a difference of 11.1%.
Cognitive Disability Correlation Summary
| Measurement | Barbadian | Immigrants from Canada |
| Minimum | 1.0% | 6.0% |
| Maximum | 42.5% | 58.1% |
| Range | 41.4% | 52.1% |
| Mean | 17.8% | 18.4% |
| Median | 18.2% | 15.7% |
| Interquartile 25% (IQ1) | 16.3% | 12.7% |
| Interquartile 75% (IQ3) | 19.7% | 19.7% |
| Interquartile Range (IQR) | 3.4% | 7.0% |
| Standard Deviation (Sample) | 5.0% | 10.6% |
| Standard Deviation (Population) | 4.9% | 10.5% |
Similar Demographics by Cognitive Disability
Demographics Similar to Barbadians by Cognitive Disability
In terms of cognitive disability, the demographic groups most similar to Barbadians are Immigrants from Kenya (18.3%, a difference of 0.010%), Immigrants from Eritrea (18.3%, a difference of 0.060%), Immigrants from Ghana (18.3%, a difference of 0.080%), Colville (18.3%, a difference of 0.18%), and Seminole (18.3%, a difference of 0.19%).
| Demographics | Rating | Rank | Cognitive Disability |
| German Russians | 0.0 /100 | #295 | Tragic 18.2% |
| Immigrants | Burma/Myanmar | 0.0 /100 | #296 | Tragic 18.2% |
| Blackfeet | 0.0 /100 | #297 | Tragic 18.3% |
| Japanese | 0.0 /100 | #298 | Tragic 18.3% |
| Ghanaians | 0.0 /100 | #299 | Tragic 18.3% |
| Creek | 0.0 /100 | #300 | Tragic 18.3% |
| Immigrants | Ghana | 0.0 /100 | #301 | Tragic 18.3% |
| Barbadians | 0.0 /100 | #302 | Tragic 18.3% |
| Immigrants | Kenya | 0.0 /100 | #303 | Tragic 18.3% |
| Immigrants | Eritrea | 0.0 /100 | #304 | Tragic 18.3% |
| Colville | 0.0 /100 | #305 | Tragic 18.3% |
| Seminole | 0.0 /100 | #306 | Tragic 18.3% |
| Ugandans | 0.0 /100 | #307 | Tragic 18.3% |
| Immigrants | Western Africa | 0.0 /100 | #308 | Tragic 18.4% |
| Immigrants | Eastern Africa | 0.0 /100 | #309 | Tragic 18.4% |
Demographics Similar to Immigrants from Canada by Cognitive Disability
In terms of cognitive disability, the demographic groups most similar to Immigrants from Canada are Macedonian (16.5%, a difference of 0.030%), Immigrants from Europe (16.5%, a difference of 0.030%), Immigrants from Colombia (16.5%, a difference of 0.050%), Hungarian (16.5%, a difference of 0.060%), and Immigrants from Italy (16.5%, a difference of 0.070%).
| Demographics | Rating | Rank | Cognitive Disability |
| Greeks | 99.9 /100 | #36 | Exceptional 16.4% |
| Slovenes | 99.9 /100 | #37 | Exceptional 16.5% |
| Immigrants | Eastern Europe | 99.9 /100 | #38 | Exceptional 16.5% |
| Bolivians | 99.9 /100 | #39 | Exceptional 16.5% |
| Immigrants | Belarus | 99.9 /100 | #40 | Exceptional 16.5% |
| Cubans | 99.9 /100 | #41 | Exceptional 16.5% |
| Hungarians | 99.9 /100 | #42 | Exceptional 16.5% |
| Immigrants | Canada | 99.8 /100 | #43 | Exceptional 16.5% |
| Macedonians | 99.8 /100 | #44 | Exceptional 16.5% |
| Immigrants | Europe | 99.8 /100 | #45 | Exceptional 16.5% |
| Immigrants | Colombia | 99.8 /100 | #46 | Exceptional 16.5% |
| Immigrants | Italy | 99.8 /100 | #47 | Exceptional 16.5% |
| Immigrants | North America | 99.8 /100 | #48 | Exceptional 16.5% |
| Iranians | 99.8 /100 | #49 | Exceptional 16.5% |
| Norwegians | 99.8 /100 | #50 | Exceptional 16.5% |