Native/Alaskan vs Ethiopian Cognitive Disability
COMPARE
Native/Alaskan
Ethiopian
Cognitive Disability
Cognitive Disability Comparison
Natives/Alaskans
Ethiopians
18.1%
COGNITIVE DISABILITY
0.1/ 100
METRIC RATING
289th/ 347
METRIC RANK
17.9%
COGNITIVE DISABILITY
0.5/ 100
METRIC RATING
259th/ 347
METRIC RANK
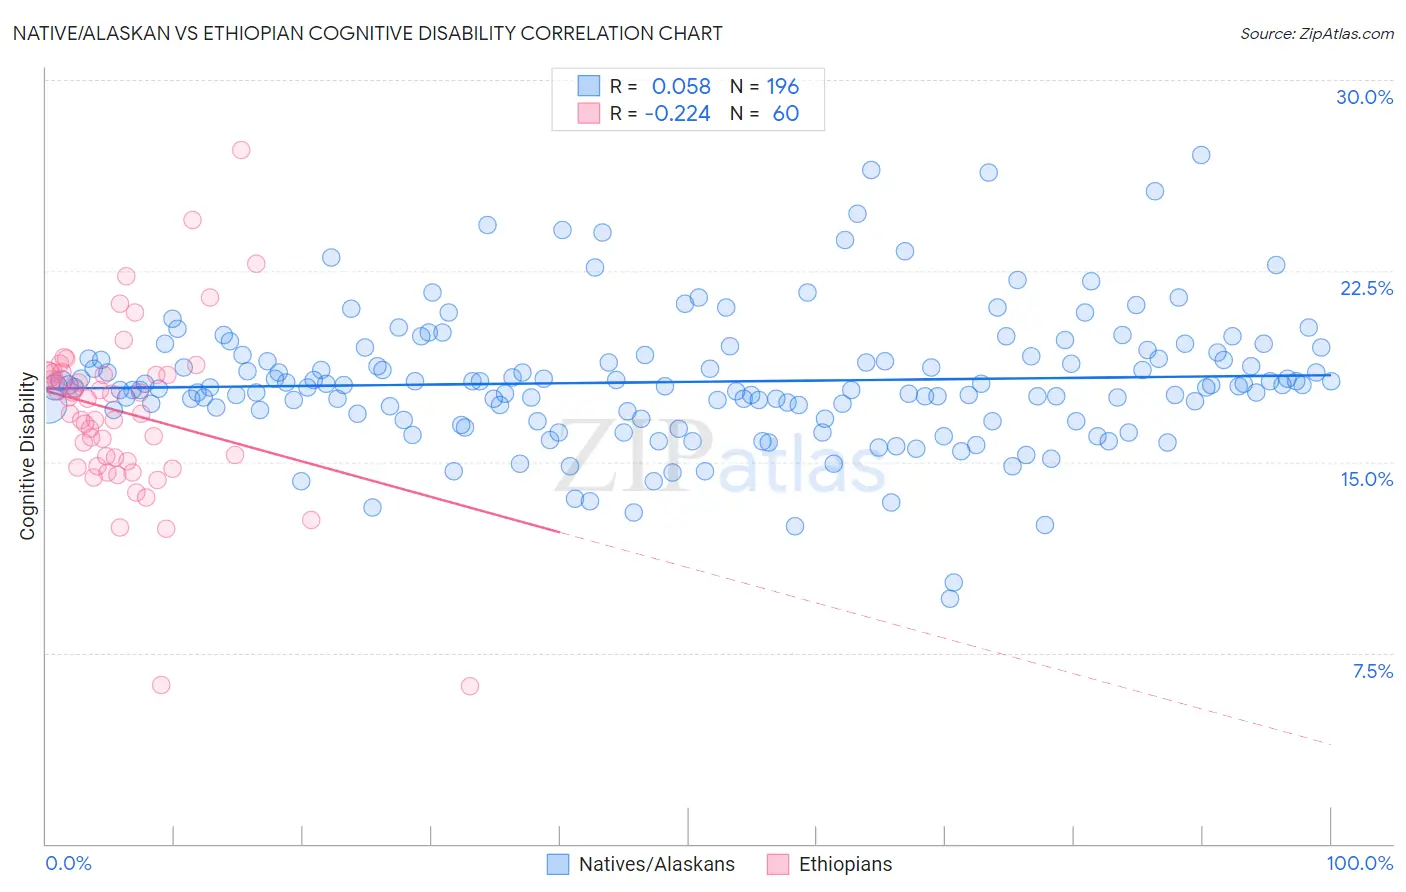
Native/Alaskan vs Ethiopian Cognitive Disability Correlation Chart
The statistical analysis conducted on geographies consisting of 512,906,873 people shows a slight positive correlation between the proportion of Natives/Alaskans and percentage of population with cognitive disability in the United States with a correlation coefficient (R) of 0.058 and weighted average of 18.1%. Similarly, the statistical analysis conducted on geographies consisting of 223,243,402 people shows a weak negative correlation between the proportion of Ethiopians and percentage of population with cognitive disability in the United States with a correlation coefficient (R) of -0.224 and weighted average of 17.9%, a difference of 1.2%.
Cognitive Disability Correlation Summary
| Measurement | Native/Alaskan | Ethiopian |
| Minimum | 9.6% | 6.2% |
| Maximum | 27.1% | 27.2% |
| Range | 17.4% | 21.1% |
| Mean | 18.1% | 16.9% |
| Median | 18.0% | 17.2% |
| Interquartile 25% (IQ1) | 16.9% | 14.9% |
| Interquartile 75% (IQ3) | 19.2% | 18.5% |
| Interquartile Range (IQR) | 2.2% | 3.6% |
| Standard Deviation (Sample) | 2.6% | 3.5% |
| Standard Deviation (Population) | 2.6% | 3.4% |
Similar Demographics by Cognitive Disability
Demographics Similar to Natives/Alaskans by Cognitive Disability
In terms of cognitive disability, the demographic groups most similar to Natives/Alaskans are Immigrants from West Indies (18.1%, a difference of 0.010%), Dutch West Indian (18.1%, a difference of 0.020%), Immigrants from Africa (18.1%, a difference of 0.030%), Kenyan (18.1%, a difference of 0.060%), and Bermudan (18.1%, a difference of 0.10%).
| Demographics | Rating | Rank | Cognitive Disability |
| Immigrants | Cambodia | 0.1 /100 | #282 | Tragic 18.1% |
| Nigerians | 0.1 /100 | #283 | Tragic 18.1% |
| Immigrants | Uganda | 0.1 /100 | #284 | Tragic 18.1% |
| Bermudans | 0.1 /100 | #285 | Tragic 18.1% |
| Kenyans | 0.1 /100 | #286 | Tragic 18.1% |
| Dutch West Indians | 0.1 /100 | #287 | Tragic 18.1% |
| Immigrants | West Indies | 0.1 /100 | #288 | Tragic 18.1% |
| Natives/Alaskans | 0.1 /100 | #289 | Tragic 18.1% |
| Immigrants | Africa | 0.1 /100 | #290 | Tragic 18.1% |
| Ottawa | 0.1 /100 | #291 | Tragic 18.2% |
| Iroquois | 0.1 /100 | #292 | Tragic 18.2% |
| Central American Indians | 0.1 /100 | #293 | Tragic 18.2% |
| British West Indians | 0.1 /100 | #294 | Tragic 18.2% |
| German Russians | 0.0 /100 | #295 | Tragic 18.2% |
| Immigrants | Burma/Myanmar | 0.0 /100 | #296 | Tragic 18.2% |
Demographics Similar to Ethiopians by Cognitive Disability
In terms of cognitive disability, the demographic groups most similar to Ethiopians are Immigrants from Belize (17.9%, a difference of 0.010%), Guamanian/Chamorro (17.9%, a difference of 0.060%), Immigrants from Armenia (17.9%, a difference of 0.080%), Mexican American Indian (17.9%, a difference of 0.090%), and Sierra Leonean (17.9%, a difference of 0.090%).
| Demographics | Rating | Rank | Cognitive Disability |
| Immigrants | Grenada | 0.6 /100 | #252 | Tragic 17.9% |
| Hopi | 0.6 /100 | #253 | Tragic 17.9% |
| Hispanics or Latinos | 0.6 /100 | #254 | Tragic 17.9% |
| Immigrants | Azores | 0.6 /100 | #255 | Tragic 17.9% |
| Bahamians | 0.6 /100 | #256 | Tragic 17.9% |
| Mexican American Indians | 0.6 /100 | #257 | Tragic 17.9% |
| Immigrants | Armenia | 0.6 /100 | #258 | Tragic 17.9% |
| Ethiopians | 0.5 /100 | #259 | Tragic 17.9% |
| Immigrants | Belize | 0.5 /100 | #260 | Tragic 17.9% |
| Guamanians/Chamorros | 0.5 /100 | #261 | Tragic 17.9% |
| Sierra Leoneans | 0.4 /100 | #262 | Tragic 17.9% |
| Immigrants | Barbados | 0.4 /100 | #263 | Tragic 17.9% |
| Menominee | 0.4 /100 | #264 | Tragic 18.0% |
| Spanish Americans | 0.4 /100 | #265 | Tragic 18.0% |
| Belizeans | 0.4 /100 | #266 | Tragic 18.0% |