Immigrants from Taiwan vs Immigrants from Bulgaria Self-Care Disability
COMPARE
Immigrants from Taiwan
Immigrants from Bulgaria
Self-Care Disability
Self-Care Disability Comparison
Immigrants from Taiwan
Immigrants from Bulgaria
2.2%
SELF-CARE DISABILITY
100.0/ 100
METRIC RATING
18th/ 347
METRIC RANK
2.3%
SELF-CARE DISABILITY
99.8/ 100
METRIC RATING
39th/ 347
METRIC RANK
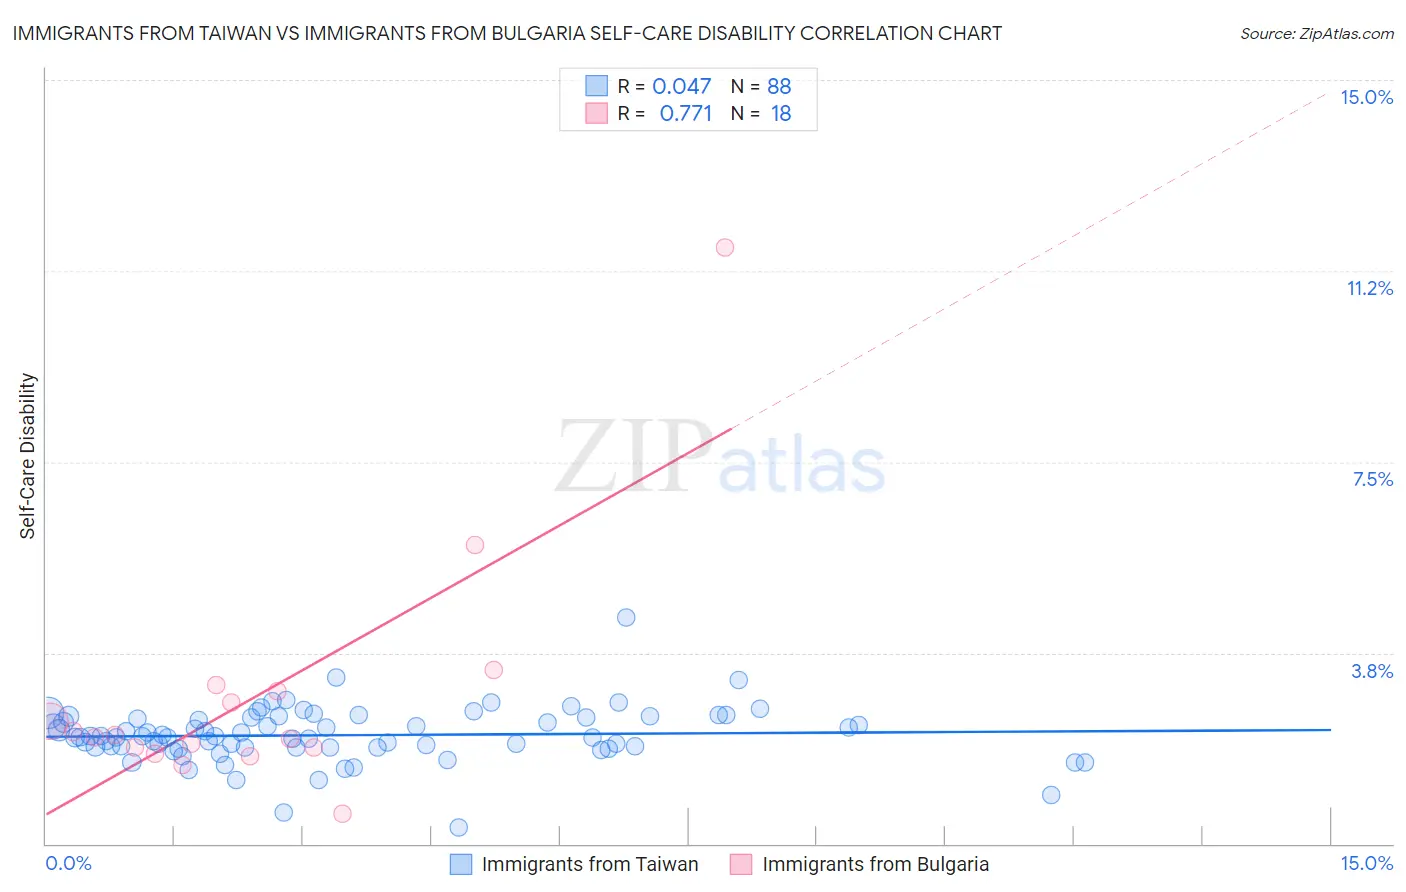
Immigrants from Taiwan vs Immigrants from Bulgaria Self-Care Disability Correlation Chart
The statistical analysis conducted on geographies consisting of 297,966,372 people shows no correlation between the proportion of Immigrants from Taiwan and percentage of population with self-care disability in the United States with a correlation coefficient (R) of 0.047 and weighted average of 2.2%. Similarly, the statistical analysis conducted on geographies consisting of 172,509,254 people shows a strong positive correlation between the proportion of Immigrants from Bulgaria and percentage of population with self-care disability in the United States with a correlation coefficient (R) of 0.771 and weighted average of 2.3%, a difference of 2.9%.
Self-Care Disability Correlation Summary
| Measurement | Immigrants from Taiwan | Immigrants from Bulgaria |
| Minimum | 0.31% | 0.60% |
| Maximum | 4.4% | 11.7% |
| Range | 4.1% | 11.1% |
| Mean | 2.1% | 2.9% |
| Median | 2.1% | 2.1% |
| Interquartile 25% (IQ1) | 1.9% | 1.9% |
| Interquartile 75% (IQ3) | 2.5% | 3.0% |
| Interquartile Range (IQR) | 0.58% | 1.1% |
| Standard Deviation (Sample) | 0.54% | 2.4% |
| Standard Deviation (Population) | 0.54% | 2.4% |
Similar Demographics by Self-Care Disability
Demographics Similar to Immigrants from Taiwan by Self-Care Disability
In terms of self-care disability, the demographic groups most similar to Immigrants from Taiwan are Immigrants from Saudi Arabia (2.2%, a difference of 0.25%), Immigrants from Eritrea (2.2%, a difference of 0.33%), Tongan (2.2%, a difference of 0.41%), Immigrants from Kuwait (2.2%, a difference of 0.42%), and Bulgarian (2.2%, a difference of 0.66%).
| Demographics | Rating | Rank | Self-Care Disability |
| Immigrants | South Central Asia | 100.0 /100 | #11 | Exceptional 2.2% |
| Immigrants | Ethiopia | 100.0 /100 | #12 | Exceptional 2.2% |
| Ethiopians | 100.0 /100 | #13 | Exceptional 2.2% |
| Luxembourgers | 100.0 /100 | #14 | Exceptional 2.2% |
| Okinawans | 100.0 /100 | #15 | Exceptional 2.2% |
| Immigrants | Kuwait | 100.0 /100 | #16 | Exceptional 2.2% |
| Immigrants | Saudi Arabia | 100.0 /100 | #17 | Exceptional 2.2% |
| Immigrants | Taiwan | 100.0 /100 | #18 | Exceptional 2.2% |
| Immigrants | Eritrea | 100.0 /100 | #19 | Exceptional 2.2% |
| Tongans | 100.0 /100 | #20 | Exceptional 2.2% |
| Bulgarians | 100.0 /100 | #21 | Exceptional 2.2% |
| Immigrants | Venezuela | 100.0 /100 | #22 | Exceptional 2.2% |
| Cambodians | 100.0 /100 | #23 | Exceptional 2.2% |
| Cypriots | 100.0 /100 | #24 | Exceptional 2.2% |
| Turks | 100.0 /100 | #25 | Exceptional 2.2% |
Demographics Similar to Immigrants from Bulgaria by Self-Care Disability
In terms of self-care disability, the demographic groups most similar to Immigrants from Bulgaria are Iranian (2.3%, a difference of 0.040%), Immigrants from Eastern Africa (2.3%, a difference of 0.10%), Immigrants from Sudan (2.3%, a difference of 0.11%), Immigrants from Uganda (2.3%, a difference of 0.21%), and Immigrants from Sweden (2.3%, a difference of 0.23%).
| Demographics | Rating | Rank | Self-Care Disability |
| Burmese | 99.9 /100 | #32 | Exceptional 2.3% |
| Immigrants | Korea | 99.9 /100 | #33 | Exceptional 2.3% |
| Immigrants | Turkey | 99.9 /100 | #34 | Exceptional 2.3% |
| Immigrants | Australia | 99.9 /100 | #35 | Exceptional 2.3% |
| Immigrants | Lithuania | 99.9 /100 | #36 | Exceptional 2.3% |
| Immigrants | Sweden | 99.9 /100 | #37 | Exceptional 2.3% |
| Immigrants | Eastern Africa | 99.9 /100 | #38 | Exceptional 2.3% |
| Immigrants | Bulgaria | 99.8 /100 | #39 | Exceptional 2.3% |
| Iranians | 99.8 /100 | #40 | Exceptional 2.3% |
| Immigrants | Sudan | 99.8 /100 | #41 | Exceptional 2.3% |
| Immigrants | Uganda | 99.8 /100 | #42 | Exceptional 2.3% |
| Immigrants | Pakistan | 99.8 /100 | #43 | Exceptional 2.3% |
| Immigrants | South Africa | 99.8 /100 | #44 | Exceptional 2.3% |
| Norwegians | 99.8 /100 | #45 | Exceptional 2.3% |
| Czechs | 99.8 /100 | #46 | Exceptional 2.3% |