Native/Alaskan vs Immigrants from Bulgaria 3rd Grade
COMPARE
Native/Alaskan
Immigrants from Bulgaria
3rd Grade
3rd Grade Comparison
Natives/Alaskans
Immigrants from Bulgaria
97.7%
3RD GRADE
35.2/ 100
METRIC RATING
187th/ 347
METRIC RANK
97.9%
3RD GRADE
89.1/ 100
METRIC RATING
131st/ 347
METRIC RANK
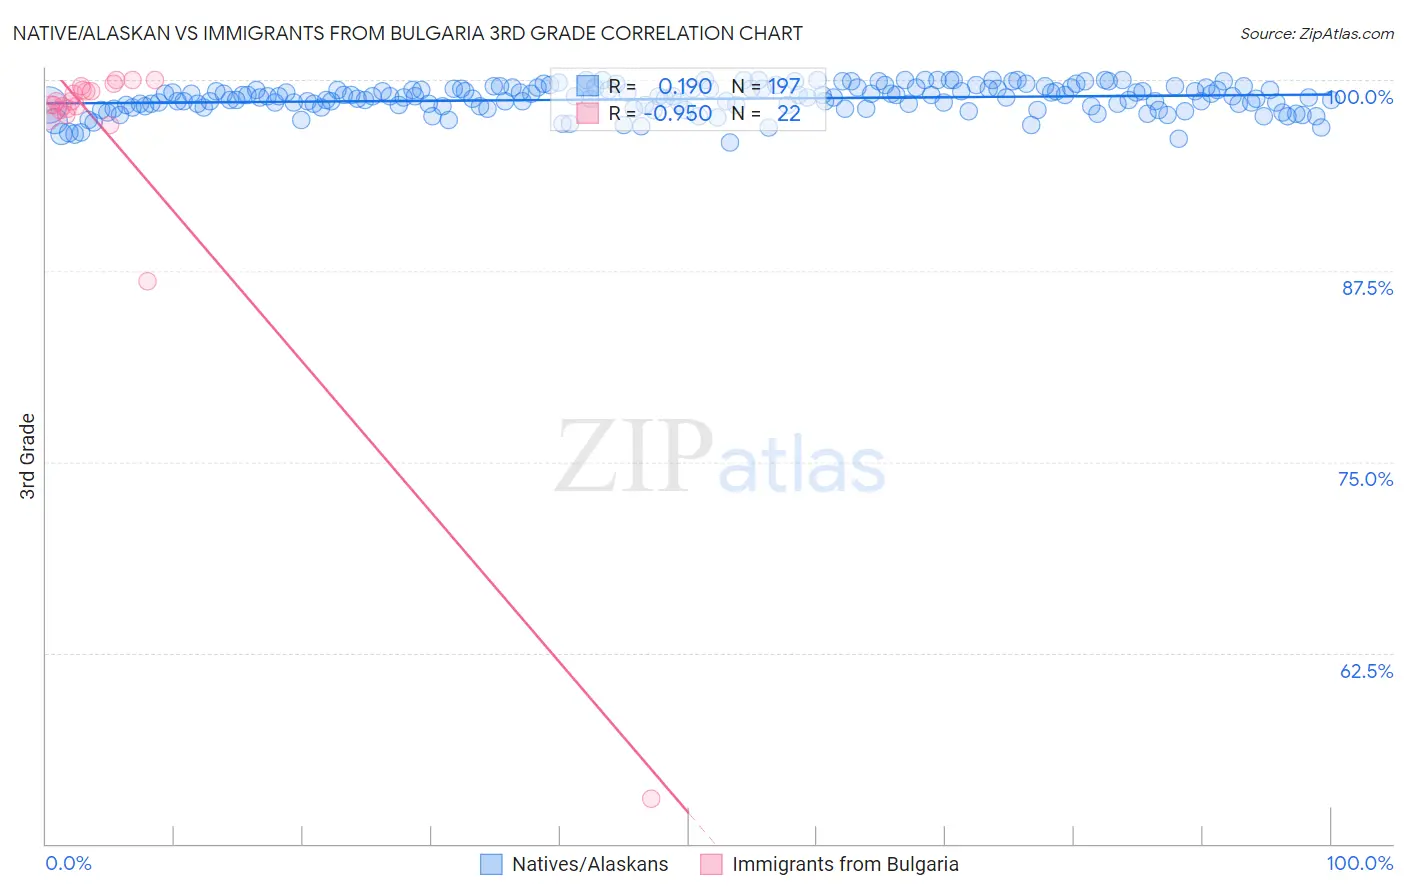
Native/Alaskan vs Immigrants from Bulgaria 3rd Grade Correlation Chart
The statistical analysis conducted on geographies consisting of 513,058,987 people shows a poor positive correlation between the proportion of Natives/Alaskans and percentage of population with at least 3rd grade education in the United States with a correlation coefficient (R) of 0.190 and weighted average of 97.7%. Similarly, the statistical analysis conducted on geographies consisting of 172,552,181 people shows a perfect negative correlation between the proportion of Immigrants from Bulgaria and percentage of population with at least 3rd grade education in the United States with a correlation coefficient (R) of -0.950 and weighted average of 97.9%, a difference of 0.23%.
3rd Grade Correlation Summary
| Measurement | Native/Alaskan | Immigrants from Bulgaria |
| Minimum | 95.9% | 52.9% |
| Maximum | 100.0% | 100.0% |
| Range | 4.1% | 47.1% |
| Mean | 98.8% | 96.1% |
| Median | 98.9% | 98.5% |
| Interquartile 25% (IQ1) | 98.3% | 98.1% |
| Interquartile 75% (IQ3) | 99.4% | 99.4% |
| Interquartile Range (IQR) | 1.2% | 1.3% |
| Standard Deviation (Sample) | 0.88% | 10.0% |
| Standard Deviation (Population) | 0.88% | 9.8% |
Similar Demographics by 3rd Grade
Demographics Similar to Natives/Alaskans by 3rd Grade
In terms of 3rd grade, the demographic groups most similar to Natives/Alaskans are Portuguese (97.7%, a difference of 0.0%), Immigrants from Taiwan (97.7%, a difference of 0.0%), Pakistani (97.7%, a difference of 0.0%), Immigrants from Kazakhstan (97.7%, a difference of 0.010%), and Immigrants from Argentina (97.7%, a difference of 0.010%).
| Demographics | Rating | Rank | 3rd Grade |
| Immigrants | Sri Lanka | 45.1 /100 | #180 | Average 97.7% |
| Immigrants | Venezuela | 44.4 /100 | #181 | Average 97.7% |
| Argentineans | 42.9 /100 | #182 | Average 97.7% |
| Arabs | 40.0 /100 | #183 | Fair 97.7% |
| Immigrants | Kazakhstan | 37.4 /100 | #184 | Fair 97.7% |
| Immigrants | Argentina | 37.0 /100 | #185 | Fair 97.7% |
| Portuguese | 36.2 /100 | #186 | Fair 97.7% |
| Natives/Alaskans | 35.2 /100 | #187 | Fair 97.7% |
| Immigrants | Taiwan | 34.2 /100 | #188 | Fair 97.7% |
| Pakistanis | 34.2 /100 | #189 | Fair 97.7% |
| Panamanians | 31.5 /100 | #190 | Fair 97.7% |
| Blacks/African Americans | 29.6 /100 | #191 | Fair 97.7% |
| Mongolians | 29.1 /100 | #192 | Fair 97.7% |
| Immigrants | Kenya | 28.2 /100 | #193 | Fair 97.7% |
| Immigrants | Uganda | 27.4 /100 | #194 | Fair 97.7% |
Demographics Similar to Immigrants from Bulgaria by 3rd Grade
In terms of 3rd grade, the demographic groups most similar to Immigrants from Bulgaria are Immigrants from Hungary (97.9%, a difference of 0.0%), Immigrants from Kuwait (97.9%, a difference of 0.0%), Seminole (97.9%, a difference of 0.0%), Cambodian (97.9%, a difference of 0.010%), and Spaniard (97.9%, a difference of 0.010%).
| Demographics | Rating | Rank | 3rd Grade |
| Immigrants | Japan | 93.7 /100 | #124 | Exceptional 98.0% |
| Immigrants | Saudi Arabia | 93.5 /100 | #125 | Exceptional 98.0% |
| Immigrants | Zimbabwe | 93.4 /100 | #126 | Exceptional 98.0% |
| Ute | 93.2 /100 | #127 | Exceptional 98.0% |
| Colville | 92.1 /100 | #128 | Exceptional 98.0% |
| Immigrants | Serbia | 91.9 /100 | #129 | Exceptional 98.0% |
| Immigrants | Europe | 91.2 /100 | #130 | Exceptional 98.0% |
| Immigrants | Bulgaria | 89.1 /100 | #131 | Excellent 97.9% |
| Immigrants | Hungary | 88.8 /100 | #132 | Excellent 97.9% |
| Immigrants | Kuwait | 88.7 /100 | #133 | Excellent 97.9% |
| Seminole | 88.7 /100 | #134 | Excellent 97.9% |
| Cambodians | 88.1 /100 | #135 | Excellent 97.9% |
| Spaniards | 87.9 /100 | #136 | Excellent 97.9% |
| Immigrants | Romania | 87.9 /100 | #137 | Excellent 97.9% |
| Israelis | 86.6 /100 | #138 | Excellent 97.9% |