Native Hawaiian vs Irish Disability
COMPARE
Native Hawaiian
Irish
Disability
Disability Comparison
Native Hawaiians
Irish
12.5%
DISABILITY
0.3/ 100
METRIC RATING
262nd/ 347
METRIC RANK
12.9%
DISABILITY
0.0/ 100
METRIC RATING
283rd/ 347
METRIC RANK
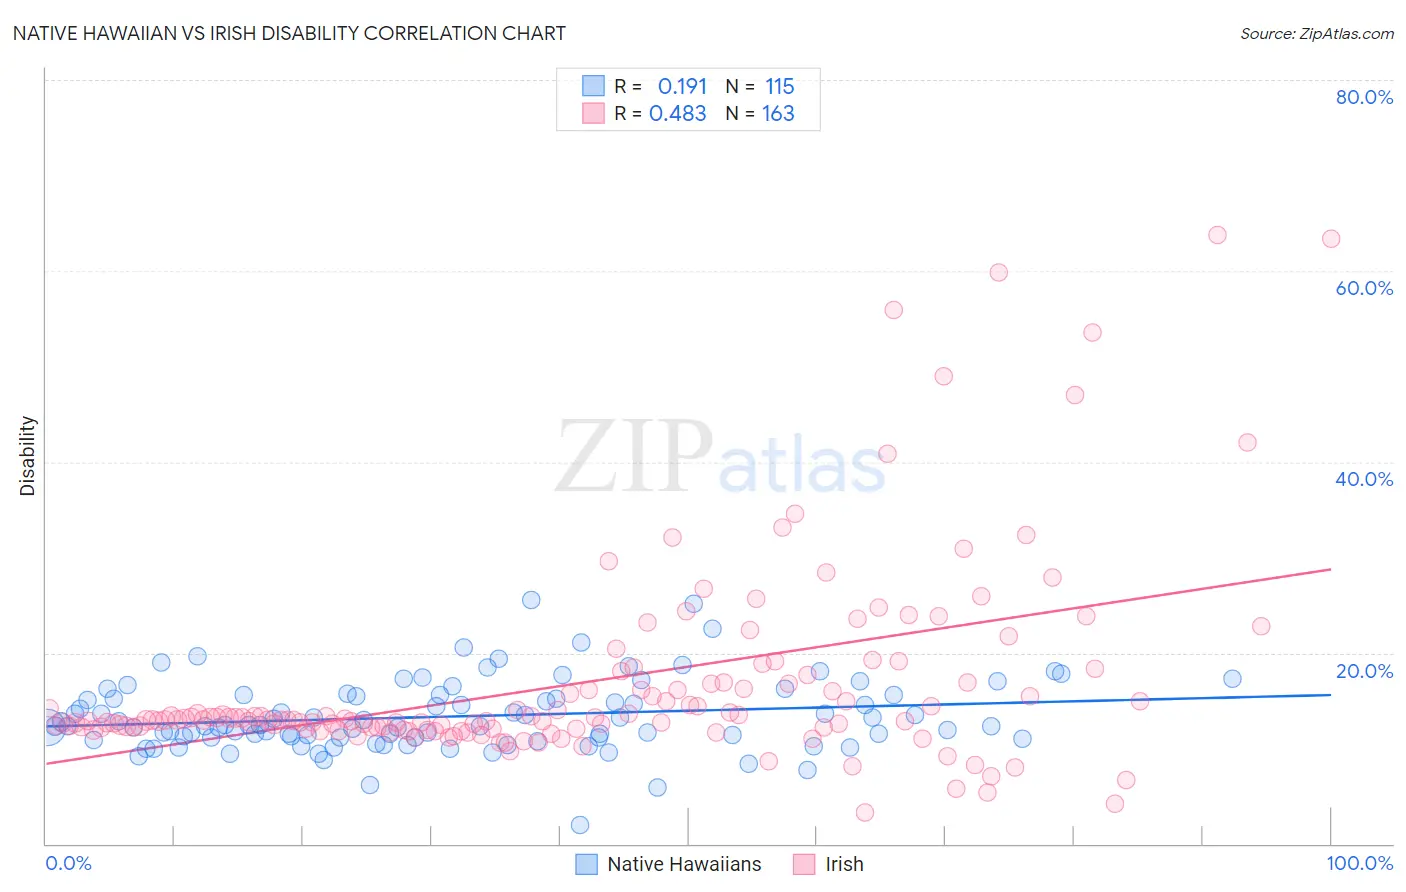
Native Hawaiian vs Irish Disability Correlation Chart
The statistical analysis conducted on geographies consisting of 332,036,989 people shows a poor positive correlation between the proportion of Native Hawaiians and percentage of population with a disability in the United States with a correlation coefficient (R) of 0.191 and weighted average of 12.5%. Similarly, the statistical analysis conducted on geographies consisting of 580,478,993 people shows a moderate positive correlation between the proportion of Irish and percentage of population with a disability in the United States with a correlation coefficient (R) of 0.483 and weighted average of 12.9%, a difference of 3.5%.
Disability Correlation Summary
| Measurement | Native Hawaiian | Irish |
| Minimum | 2.0% | 3.2% |
| Maximum | 25.6% | 63.7% |
| Range | 23.6% | 60.5% |
| Mean | 13.3% | 16.8% |
| Median | 12.4% | 13.0% |
| Interquartile 25% (IQ1) | 11.2% | 12.2% |
| Interquartile 75% (IQ3) | 15.5% | 16.9% |
| Interquartile Range (IQR) | 4.4% | 4.7% |
| Standard Deviation (Sample) | 3.7% | 10.5% |
| Standard Deviation (Population) | 3.7% | 10.4% |
Similar Demographics by Disability
Demographics Similar to Native Hawaiians by Disability
In terms of disability, the demographic groups most similar to Native Hawaiians are Hawaiian (12.5%, a difference of 0.20%), Scandinavian (12.4%, a difference of 0.27%), Immigrants from Germany (12.5%, a difference of 0.32%), U.S. Virgin Islander (12.5%, a difference of 0.33%), and Immigrants from Liberia (12.4%, a difference of 0.34%).
| Demographics | Rating | Rank | Disability |
| Slovenes | 0.6 /100 | #255 | Tragic 12.4% |
| Immigrants | Dominica | 0.6 /100 | #256 | Tragic 12.4% |
| Immigrants | Laos | 0.5 /100 | #257 | Tragic 12.4% |
| Slavs | 0.5 /100 | #258 | Tragic 12.4% |
| Canadians | 0.4 /100 | #259 | Tragic 12.4% |
| Immigrants | Liberia | 0.4 /100 | #260 | Tragic 12.4% |
| Scandinavians | 0.4 /100 | #261 | Tragic 12.4% |
| Native Hawaiians | 0.3 /100 | #262 | Tragic 12.5% |
| Hawaiians | 0.2 /100 | #263 | Tragic 12.5% |
| Immigrants | Germany | 0.2 /100 | #264 | Tragic 12.5% |
| U.S. Virgin Islanders | 0.2 /100 | #265 | Tragic 12.5% |
| Czechoslovakians | 0.2 /100 | #266 | Tragic 12.5% |
| Spaniards | 0.2 /100 | #267 | Tragic 12.5% |
| Bangladeshis | 0.1 /100 | #268 | Tragic 12.6% |
| Immigrants | Dominican Republic | 0.1 /100 | #269 | Tragic 12.6% |
Demographics Similar to Irish by Disability
In terms of disability, the demographic groups most similar to Irish are Scottish (12.9%, a difference of 0.020%), Immigrants from Portugal (12.9%, a difference of 0.16%), Welsh (12.9%, a difference of 0.19%), Crow (12.9%, a difference of 0.20%), and Spanish (12.8%, a difference of 0.30%).
| Demographics | Rating | Rank | Disability |
| Hmong | 0.0 /100 | #276 | Tragic 12.8% |
| Dutch | 0.0 /100 | #277 | Tragic 12.8% |
| Germans | 0.0 /100 | #278 | Tragic 12.8% |
| Fijians | 0.0 /100 | #279 | Tragic 12.8% |
| Spanish | 0.0 /100 | #280 | Tragic 12.8% |
| Immigrants | Portugal | 0.0 /100 | #281 | Tragic 12.9% |
| Scottish | 0.0 /100 | #282 | Tragic 12.9% |
| Irish | 0.0 /100 | #283 | Tragic 12.9% |
| Welsh | 0.0 /100 | #284 | Tragic 12.9% |
| Crow | 0.0 /100 | #285 | Tragic 12.9% |
| English | 0.0 /100 | #286 | Tragic 13.0% |
| Africans | 0.0 /100 | #287 | Tragic 13.0% |
| Whites/Caucasians | 0.0 /100 | #288 | Tragic 13.0% |
| Slovaks | 0.0 /100 | #289 | Tragic 13.0% |
| Cheyenne | 0.0 /100 | #290 | Tragic 13.0% |