Nicaraguan vs Irish Disability
COMPARE
Nicaraguan
Irish
Disability
Disability Comparison
Nicaraguans
Irish
11.3%
DISABILITY
96.2/ 100
METRIC RATING
107th/ 347
METRIC RANK
12.9%
DISABILITY
0.0/ 100
METRIC RATING
283rd/ 347
METRIC RANK
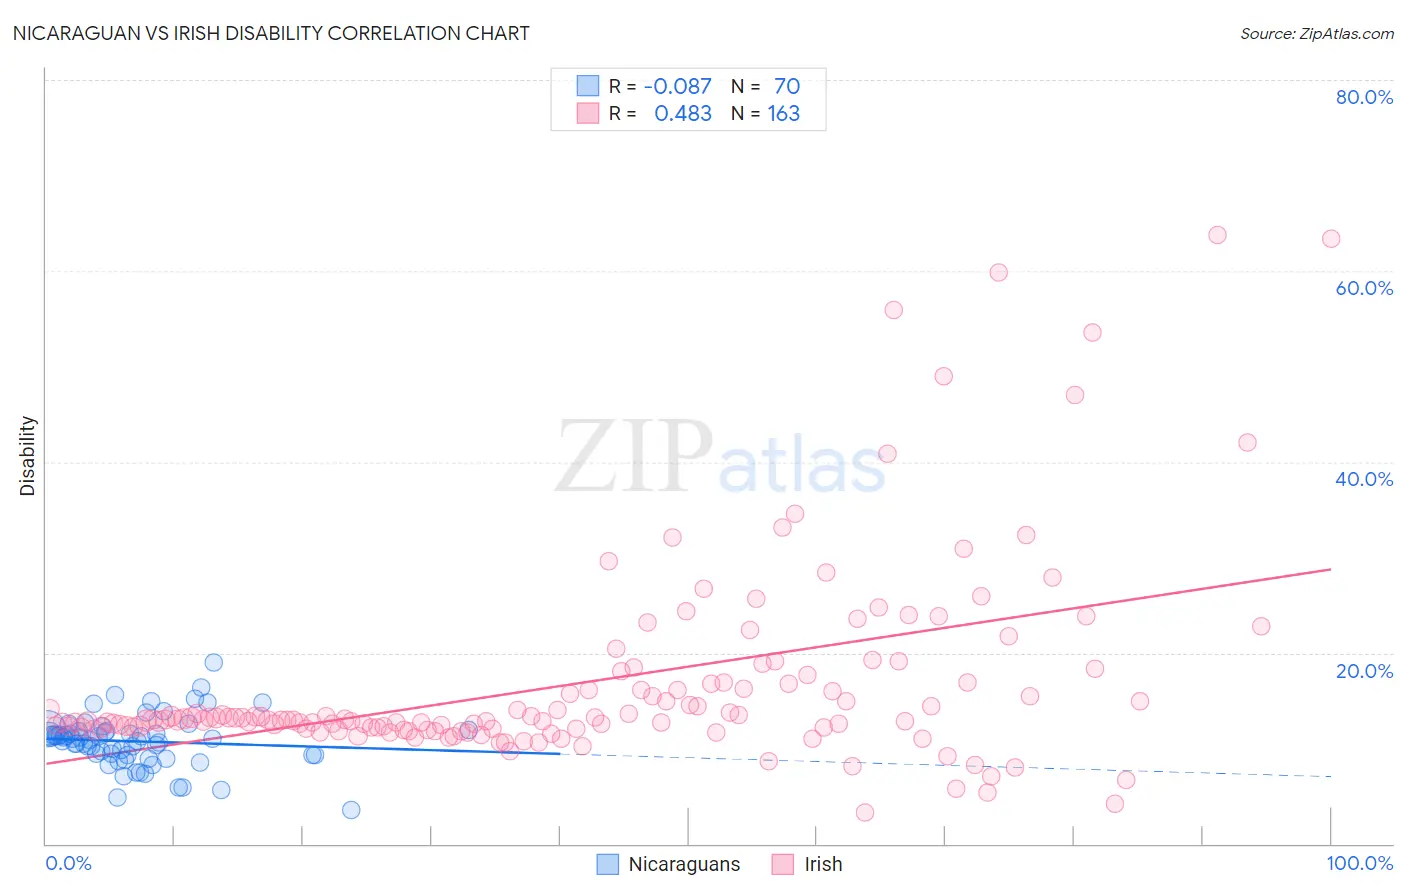
Nicaraguan vs Irish Disability Correlation Chart
The statistical analysis conducted on geographies consisting of 285,692,565 people shows a slight negative correlation between the proportion of Nicaraguans and percentage of population with a disability in the United States with a correlation coefficient (R) of -0.087 and weighted average of 11.3%. Similarly, the statistical analysis conducted on geographies consisting of 580,478,993 people shows a moderate positive correlation between the proportion of Irish and percentage of population with a disability in the United States with a correlation coefficient (R) of 0.483 and weighted average of 12.9%, a difference of 14.2%.
Disability Correlation Summary
| Measurement | Nicaraguan | Irish |
| Minimum | 3.5% | 3.2% |
| Maximum | 19.0% | 63.7% |
| Range | 15.6% | 60.5% |
| Mean | 10.7% | 16.8% |
| Median | 10.9% | 13.0% |
| Interquartile 25% (IQ1) | 9.3% | 12.2% |
| Interquartile 75% (IQ3) | 11.7% | 16.9% |
| Interquartile Range (IQR) | 2.5% | 4.7% |
| Standard Deviation (Sample) | 2.7% | 10.5% |
| Standard Deviation (Population) | 2.7% | 10.4% |
Similar Demographics by Disability
Demographics Similar to Nicaraguans by Disability
In terms of disability, the demographic groups most similar to Nicaraguans are Immigrants from Eastern Europe (11.3%, a difference of 0.020%), Immigrants from Kazakhstan (11.3%, a difference of 0.050%), Immigrants from Uruguay (11.3%, a difference of 0.060%), Immigrants (11.3%, a difference of 0.060%), and Immigrants from Nigeria (11.3%, a difference of 0.080%).
| Demographics | Rating | Rank | Disability |
| Immigrants | Greece | 96.9 /100 | #100 | Exceptional 11.3% |
| Immigrants | Nicaragua | 96.8 /100 | #101 | Exceptional 11.3% |
| Immigrants | Eastern Africa | 96.7 /100 | #102 | Exceptional 11.3% |
| Immigrants | Uruguay | 96.4 /100 | #103 | Exceptional 11.3% |
| Immigrants | Immigrants | 96.4 /100 | #104 | Exceptional 11.3% |
| Immigrants | Kazakhstan | 96.4 /100 | #105 | Exceptional 11.3% |
| Immigrants | Eastern Europe | 96.3 /100 | #106 | Exceptional 11.3% |
| Nicaraguans | 96.2 /100 | #107 | Exceptional 11.3% |
| Immigrants | Nigeria | 96.0 /100 | #108 | Exceptional 11.3% |
| Immigrants | Uganda | 95.7 /100 | #109 | Exceptional 11.3% |
| Immigrants | Denmark | 95.6 /100 | #110 | Exceptional 11.3% |
| Immigrants | South Eastern Asia | 95.4 /100 | #111 | Exceptional 11.3% |
| Immigrants | Uzbekistan | 94.9 /100 | #112 | Exceptional 11.3% |
| Guyanese | 94.7 /100 | #113 | Exceptional 11.3% |
| Immigrants | Syria | 94.7 /100 | #114 | Exceptional 11.3% |
Demographics Similar to Irish by Disability
In terms of disability, the demographic groups most similar to Irish are Scottish (12.9%, a difference of 0.020%), Immigrants from Portugal (12.9%, a difference of 0.16%), Welsh (12.9%, a difference of 0.19%), Crow (12.9%, a difference of 0.20%), and Spanish (12.8%, a difference of 0.30%).
| Demographics | Rating | Rank | Disability |
| Hmong | 0.0 /100 | #276 | Tragic 12.8% |
| Dutch | 0.0 /100 | #277 | Tragic 12.8% |
| Germans | 0.0 /100 | #278 | Tragic 12.8% |
| Fijians | 0.0 /100 | #279 | Tragic 12.8% |
| Spanish | 0.0 /100 | #280 | Tragic 12.8% |
| Immigrants | Portugal | 0.0 /100 | #281 | Tragic 12.9% |
| Scottish | 0.0 /100 | #282 | Tragic 12.9% |
| Irish | 0.0 /100 | #283 | Tragic 12.9% |
| Welsh | 0.0 /100 | #284 | Tragic 12.9% |
| Crow | 0.0 /100 | #285 | Tragic 12.9% |
| English | 0.0 /100 | #286 | Tragic 13.0% |
| Africans | 0.0 /100 | #287 | Tragic 13.0% |
| Whites/Caucasians | 0.0 /100 | #288 | Tragic 13.0% |
| Slovaks | 0.0 /100 | #289 | Tragic 13.0% |
| Cheyenne | 0.0 /100 | #290 | Tragic 13.0% |