Native Hawaiian vs Immigrants from South America Disability
COMPARE
Native Hawaiian
Immigrants from South America
Disability
Disability Comparison
Native Hawaiians
Immigrants from South America
12.5%
DISABILITY
0.3/ 100
METRIC RATING
262nd/ 347
METRIC RANK
10.9%
DISABILITY
99.8/ 100
METRIC RATING
58th/ 347
METRIC RANK
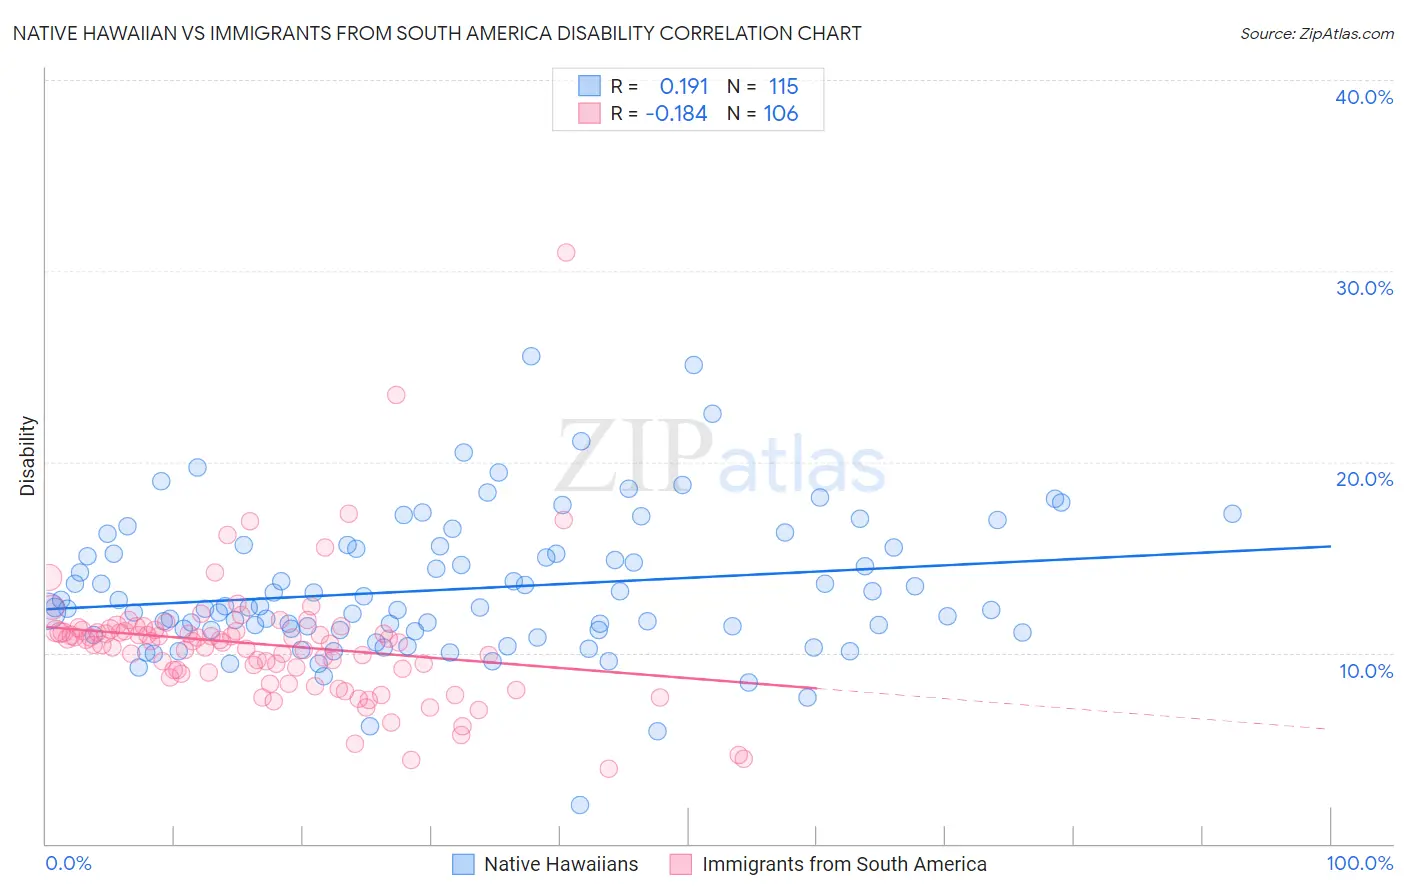
Native Hawaiian vs Immigrants from South America Disability Correlation Chart
The statistical analysis conducted on geographies consisting of 332,036,989 people shows a poor positive correlation between the proportion of Native Hawaiians and percentage of population with a disability in the United States with a correlation coefficient (R) of 0.191 and weighted average of 12.5%. Similarly, the statistical analysis conducted on geographies consisting of 486,347,042 people shows a poor negative correlation between the proportion of Immigrants from South America and percentage of population with a disability in the United States with a correlation coefficient (R) of -0.184 and weighted average of 10.9%, a difference of 14.0%.
Disability Correlation Summary
| Measurement | Native Hawaiian | Immigrants from South America |
| Minimum | 2.0% | 3.9% |
| Maximum | 25.6% | 31.0% |
| Range | 23.6% | 27.0% |
| Mean | 13.3% | 10.4% |
| Median | 12.4% | 10.6% |
| Interquartile 25% (IQ1) | 11.2% | 9.0% |
| Interquartile 75% (IQ3) | 15.5% | 11.2% |
| Interquartile Range (IQR) | 4.4% | 2.2% |
| Standard Deviation (Sample) | 3.7% | 3.4% |
| Standard Deviation (Population) | 3.7% | 3.4% |
Similar Demographics by Disability
Demographics Similar to Native Hawaiians by Disability
In terms of disability, the demographic groups most similar to Native Hawaiians are Hawaiian (12.5%, a difference of 0.20%), Scandinavian (12.4%, a difference of 0.27%), Immigrants from Germany (12.5%, a difference of 0.32%), U.S. Virgin Islander (12.5%, a difference of 0.33%), and Immigrants from Liberia (12.4%, a difference of 0.34%).
| Demographics | Rating | Rank | Disability |
| Slovenes | 0.6 /100 | #255 | Tragic 12.4% |
| Immigrants | Dominica | 0.6 /100 | #256 | Tragic 12.4% |
| Immigrants | Laos | 0.5 /100 | #257 | Tragic 12.4% |
| Slavs | 0.5 /100 | #258 | Tragic 12.4% |
| Canadians | 0.4 /100 | #259 | Tragic 12.4% |
| Immigrants | Liberia | 0.4 /100 | #260 | Tragic 12.4% |
| Scandinavians | 0.4 /100 | #261 | Tragic 12.4% |
| Native Hawaiians | 0.3 /100 | #262 | Tragic 12.5% |
| Hawaiians | 0.2 /100 | #263 | Tragic 12.5% |
| Immigrants | Germany | 0.2 /100 | #264 | Tragic 12.5% |
| U.S. Virgin Islanders | 0.2 /100 | #265 | Tragic 12.5% |
| Czechoslovakians | 0.2 /100 | #266 | Tragic 12.5% |
| Spaniards | 0.2 /100 | #267 | Tragic 12.5% |
| Bangladeshis | 0.1 /100 | #268 | Tragic 12.6% |
| Immigrants | Dominican Republic | 0.1 /100 | #269 | Tragic 12.6% |
Demographics Similar to Immigrants from South America by Disability
In terms of disability, the demographic groups most similar to Immigrants from South America are Salvadoran (10.9%, a difference of 0.030%), Immigrants from Colombia (10.9%, a difference of 0.090%), Zimbabwean (10.9%, a difference of 0.18%), Immigrants from Bulgaria (10.9%, a difference of 0.24%), and Immigrants from Lithuania (10.9%, a difference of 0.27%).
| Demographics | Rating | Rank | Disability |
| Peruvians | 99.8 /100 | #51 | Exceptional 10.9% |
| South Americans | 99.8 /100 | #52 | Exceptional 10.9% |
| Immigrants | Spain | 99.8 /100 | #53 | Exceptional 10.9% |
| Jordanians | 99.8 /100 | #54 | Exceptional 10.9% |
| Immigrants | El Salvador | 99.8 /100 | #55 | Exceptional 10.9% |
| Immigrants | Lithuania | 99.8 /100 | #56 | Exceptional 10.9% |
| Salvadorans | 99.8 /100 | #57 | Exceptional 10.9% |
| Immigrants | South America | 99.8 /100 | #58 | Exceptional 10.9% |
| Immigrants | Colombia | 99.7 /100 | #59 | Exceptional 10.9% |
| Zimbabweans | 99.7 /100 | #60 | Exceptional 10.9% |
| Immigrants | Bulgaria | 99.7 /100 | #61 | Exceptional 10.9% |
| Immigrants | Northern Africa | 99.7 /100 | #62 | Exceptional 10.9% |
| Immigrants | Eritrea | 99.7 /100 | #63 | Exceptional 11.0% |
| Immigrants | Sweden | 99.6 /100 | #64 | Exceptional 11.0% |
| Bulgarians | 99.6 /100 | #65 | Exceptional 11.0% |