Native Hawaiian vs Immigrants from Bulgaria Ambulatory Disability
COMPARE
Native Hawaiian
Immigrants from Bulgaria
Ambulatory Disability
Ambulatory Disability Comparison
Native Hawaiians
Immigrants from Bulgaria
6.5%
AMBULATORY DISABILITY
1.1/ 100
METRIC RATING
249th/ 347
METRIC RANK
5.6%
AMBULATORY DISABILITY
99.8/ 100
METRIC RATING
55th/ 347
METRIC RANK
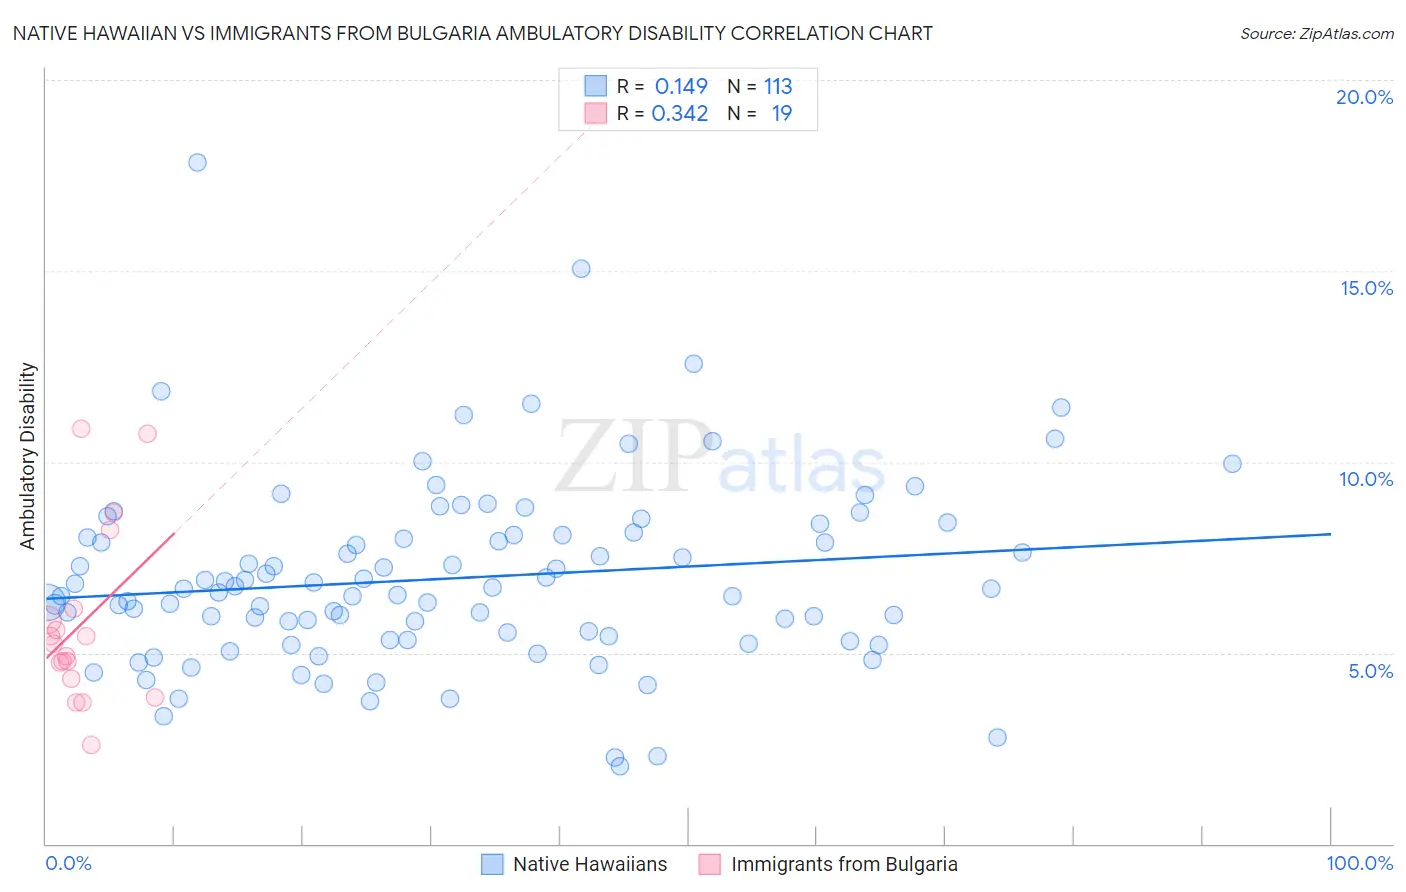
Native Hawaiian vs Immigrants from Bulgaria Ambulatory Disability Correlation Chart
The statistical analysis conducted on geographies consisting of 331,921,721 people shows a poor positive correlation between the proportion of Native Hawaiians and percentage of population with ambulatory disability in the United States with a correlation coefficient (R) of 0.149 and weighted average of 6.5%. Similarly, the statistical analysis conducted on geographies consisting of 172,546,961 people shows a mild positive correlation between the proportion of Immigrants from Bulgaria and percentage of population with ambulatory disability in the United States with a correlation coefficient (R) of 0.342 and weighted average of 5.6%, a difference of 15.6%.
Ambulatory Disability Correlation Summary
| Measurement | Native Hawaiian | Immigrants from Bulgaria |
| Minimum | 2.0% | 2.6% |
| Maximum | 17.8% | 10.9% |
| Range | 15.8% | 8.3% |
| Mean | 6.9% | 5.8% |
| Median | 6.7% | 5.2% |
| Interquartile 25% (IQ1) | 5.4% | 4.3% |
| Interquartile 75% (IQ3) | 8.1% | 6.1% |
| Interquartile Range (IQR) | 2.7% | 1.8% |
| Standard Deviation (Sample) | 2.4% | 2.3% |
| Standard Deviation (Population) | 2.4% | 2.2% |
Similar Demographics by Ambulatory Disability
Demographics Similar to Native Hawaiians by Ambulatory Disability
In terms of ambulatory disability, the demographic groups most similar to Native Hawaiians are Chinese (6.5%, a difference of 0.080%), Hawaiian (6.5%, a difference of 0.26%), Immigrants from Portugal (6.5%, a difference of 0.28%), Immigrants from Cuba (6.5%, a difference of 0.30%), and Armenian (6.5%, a difference of 0.36%).
| Demographics | Rating | Rank | Ambulatory Disability |
| Spaniards | 1.6 /100 | #242 | Tragic 6.5% |
| Germans | 1.5 /100 | #243 | Tragic 6.5% |
| Immigrants | Panama | 1.5 /100 | #244 | Tragic 6.5% |
| Tlingit-Haida | 1.5 /100 | #245 | Tragic 6.5% |
| Armenians | 1.5 /100 | #246 | Tragic 6.5% |
| Immigrants | Cuba | 1.4 /100 | #247 | Tragic 6.5% |
| Immigrants | Portugal | 1.4 /100 | #248 | Tragic 6.5% |
| Native Hawaiians | 1.1 /100 | #249 | Tragic 6.5% |
| Chinese | 1.0 /100 | #250 | Tragic 6.5% |
| Hawaiians | 0.9 /100 | #251 | Tragic 6.5% |
| Immigrants | Bahamas | 0.8 /100 | #252 | Tragic 6.5% |
| Scottish | 0.7 /100 | #253 | Tragic 6.5% |
| Belizeans | 0.7 /100 | #254 | Tragic 6.5% |
| Welsh | 0.6 /100 | #255 | Tragic 6.5% |
| Immigrants | Uzbekistan | 0.6 /100 | #256 | Tragic 6.5% |
Demographics Similar to Immigrants from Bulgaria by Ambulatory Disability
In terms of ambulatory disability, the demographic groups most similar to Immigrants from Bulgaria are Immigrants from Eastern Africa (5.6%, a difference of 0.070%), Inupiat (5.6%, a difference of 0.090%), Immigrants from Egypt (5.6%, a difference of 0.11%), Jordanian (5.6%, a difference of 0.12%), and Taiwanese (5.6%, a difference of 0.21%).
| Demographics | Rating | Rank | Ambulatory Disability |
| Immigrants | Argentina | 99.9 /100 | #48 | Exceptional 5.6% |
| Bulgarians | 99.9 /100 | #49 | Exceptional 5.6% |
| Luxembourgers | 99.9 /100 | #50 | Exceptional 5.6% |
| Taiwanese | 99.8 /100 | #51 | Exceptional 5.6% |
| Jordanians | 99.8 /100 | #52 | Exceptional 5.6% |
| Immigrants | Egypt | 99.8 /100 | #53 | Exceptional 5.6% |
| Immigrants | Eastern Africa | 99.8 /100 | #54 | Exceptional 5.6% |
| Immigrants | Bulgaria | 99.8 /100 | #55 | Exceptional 5.6% |
| Inupiat | 99.8 /100 | #56 | Exceptional 5.6% |
| Immigrants | Brazil | 99.8 /100 | #57 | Exceptional 5.6% |
| Immigrants | Zimbabwe | 99.8 /100 | #58 | Exceptional 5.6% |
| Immigrants | Afghanistan | 99.8 /100 | #59 | Exceptional 5.6% |
| Immigrants | Lithuania | 99.8 /100 | #60 | Exceptional 5.6% |
| Immigrants | Belgium | 99.7 /100 | #61 | Exceptional 5.6% |
| Immigrants | Spain | 99.7 /100 | #62 | Exceptional 5.6% |