Immigrants from Guyana vs Crow Female Disability
COMPARE
Immigrants from Guyana
Crow
Female Disability
Female Disability Comparison
Immigrants from Guyana
Crow
12.2%
FEMALE DISABILITY
43.1/ 100
METRIC RATING
176th/ 347
METRIC RANK
12.7%
FEMALE DISABILITY
1.6/ 100
METRIC RATING
251st/ 347
METRIC RANK
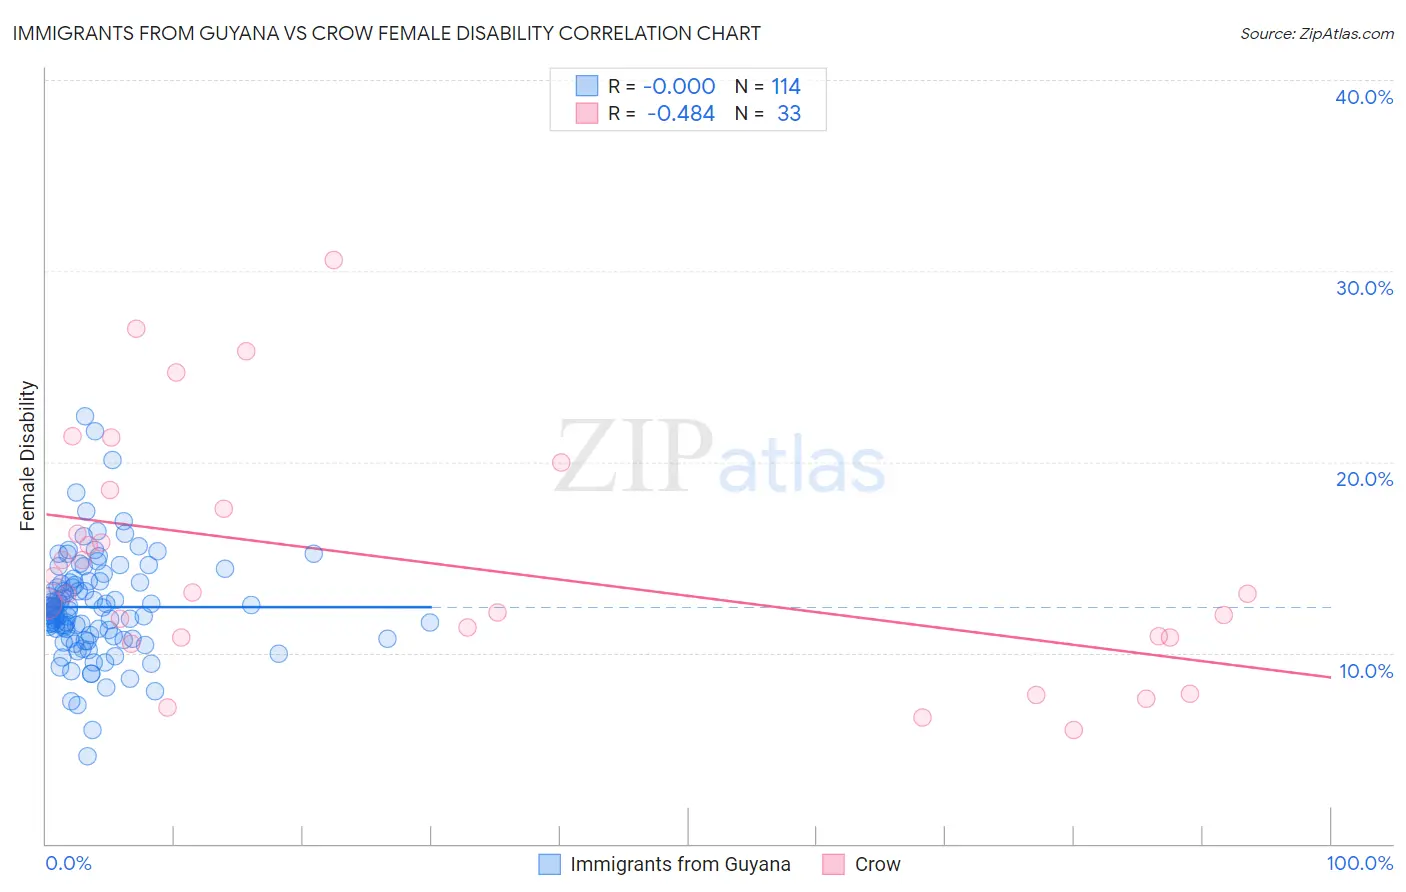
Immigrants from Guyana vs Crow Female Disability Correlation Chart
The statistical analysis conducted on geographies consisting of 183,713,039 people shows no correlation between the proportion of Immigrants from Guyana and percentage of females with a disability in the United States with a correlation coefficient (R) of -0.000 and weighted average of 12.2%. Similarly, the statistical analysis conducted on geographies consisting of 59,203,851 people shows a moderate negative correlation between the proportion of Crow and percentage of females with a disability in the United States with a correlation coefficient (R) of -0.484 and weighted average of 12.7%, a difference of 3.6%.
Female Disability Correlation Summary
| Measurement | Immigrants from Guyana | Crow |
| Minimum | 4.6% | 5.9% |
| Maximum | 22.4% | 30.6% |
| Range | 17.8% | 24.7% |
| Mean | 12.4% | 14.6% |
| Median | 12.2% | 13.1% |
| Interquartile 25% (IQ1) | 10.8% | 10.8% |
| Interquartile 75% (IQ3) | 13.7% | 18.0% |
| Interquartile Range (IQR) | 2.9% | 7.2% |
| Standard Deviation (Sample) | 2.7% | 6.2% |
| Standard Deviation (Population) | 2.7% | 6.1% |
Similar Demographics by Female Disability
Demographics Similar to Immigrants from Guyana by Female Disability
In terms of female disability, the demographic groups most similar to Immigrants from Guyana are Immigrants from Ghana (12.2%, a difference of 0.030%), Immigrants from Western Europe (12.2%, a difference of 0.080%), Immigrants from Fiji (12.3%, a difference of 0.19%), Albanian (12.3%, a difference of 0.20%), and Immigrants from Canada (12.3%, a difference of 0.23%).
| Demographics | Rating | Rank | Female Disability |
| Lebanese | 58.1 /100 | #169 | Average 12.2% |
| Maltese | 57.0 /100 | #170 | Average 12.2% |
| Immigrants | Southern Europe | 56.3 /100 | #171 | Average 12.2% |
| Haitians | 51.9 /100 | #172 | Average 12.2% |
| Immigrants | Mexico | 50.8 /100 | #173 | Average 12.2% |
| Immigrants | England | 50.0 /100 | #174 | Average 12.2% |
| Immigrants | St. Vincent and the Grenadines | 49.7 /100 | #175 | Average 12.2% |
| Immigrants | Guyana | 43.1 /100 | #176 | Average 12.2% |
| Immigrants | Ghana | 42.5 /100 | #177 | Average 12.2% |
| Immigrants | Western Europe | 40.9 /100 | #178 | Average 12.2% |
| Immigrants | Fiji | 38.2 /100 | #179 | Fair 12.3% |
| Albanians | 37.9 /100 | #180 | Fair 12.3% |
| Immigrants | Canada | 37.2 /100 | #181 | Fair 12.3% |
| Norwegians | 36.9 /100 | #182 | Fair 12.3% |
| Cubans | 36.5 /100 | #183 | Fair 12.3% |
Demographics Similar to Crow by Female Disability
In terms of female disability, the demographic groups most similar to Crow are Slovene (12.7%, a difference of 0.060%), Immigrants from Caribbean (12.7%, a difference of 0.080%), Jamaican (12.7%, a difference of 0.090%), Immigrants from Congo (12.7%, a difference of 0.10%), and Hawaiian (12.7%, a difference of 0.12%).
| Demographics | Rating | Rank | Female Disability |
| Alsatians | 2.5 /100 | #244 | Tragic 12.6% |
| Immigrants | Jamaica | 2.2 /100 | #245 | Tragic 12.6% |
| Spanish American Indians | 2.1 /100 | #246 | Tragic 12.6% |
| Menominee | 2.1 /100 | #247 | Tragic 12.6% |
| Carpatho Rusyns | 2.0 /100 | #248 | Tragic 12.6% |
| Immigrants | Congo | 1.8 /100 | #249 | Tragic 12.7% |
| Slovenes | 1.7 /100 | #250 | Tragic 12.7% |
| Crow | 1.6 /100 | #251 | Tragic 12.7% |
| Immigrants | Caribbean | 1.4 /100 | #252 | Tragic 12.7% |
| Jamaicans | 1.4 /100 | #253 | Tragic 12.7% |
| Hawaiians | 1.4 /100 | #254 | Tragic 12.7% |
| Immigrants | Germany | 1.3 /100 | #255 | Tragic 12.7% |
| British West Indians | 1.2 /100 | #256 | Tragic 12.7% |
| Liberians | 1.1 /100 | #257 | Tragic 12.7% |
| Aleuts | 1.1 /100 | #258 | Tragic 12.7% |