Colville vs Crow Female Disability
COMPARE
Colville
Crow
Female Disability
Female Disability Comparison
Colville
Crow
15.1%
FEMALE DISABILITY
0.0/ 100
METRIC RATING
339th/ 347
METRIC RANK
12.7%
FEMALE DISABILITY
1.6/ 100
METRIC RATING
251st/ 347
METRIC RANK
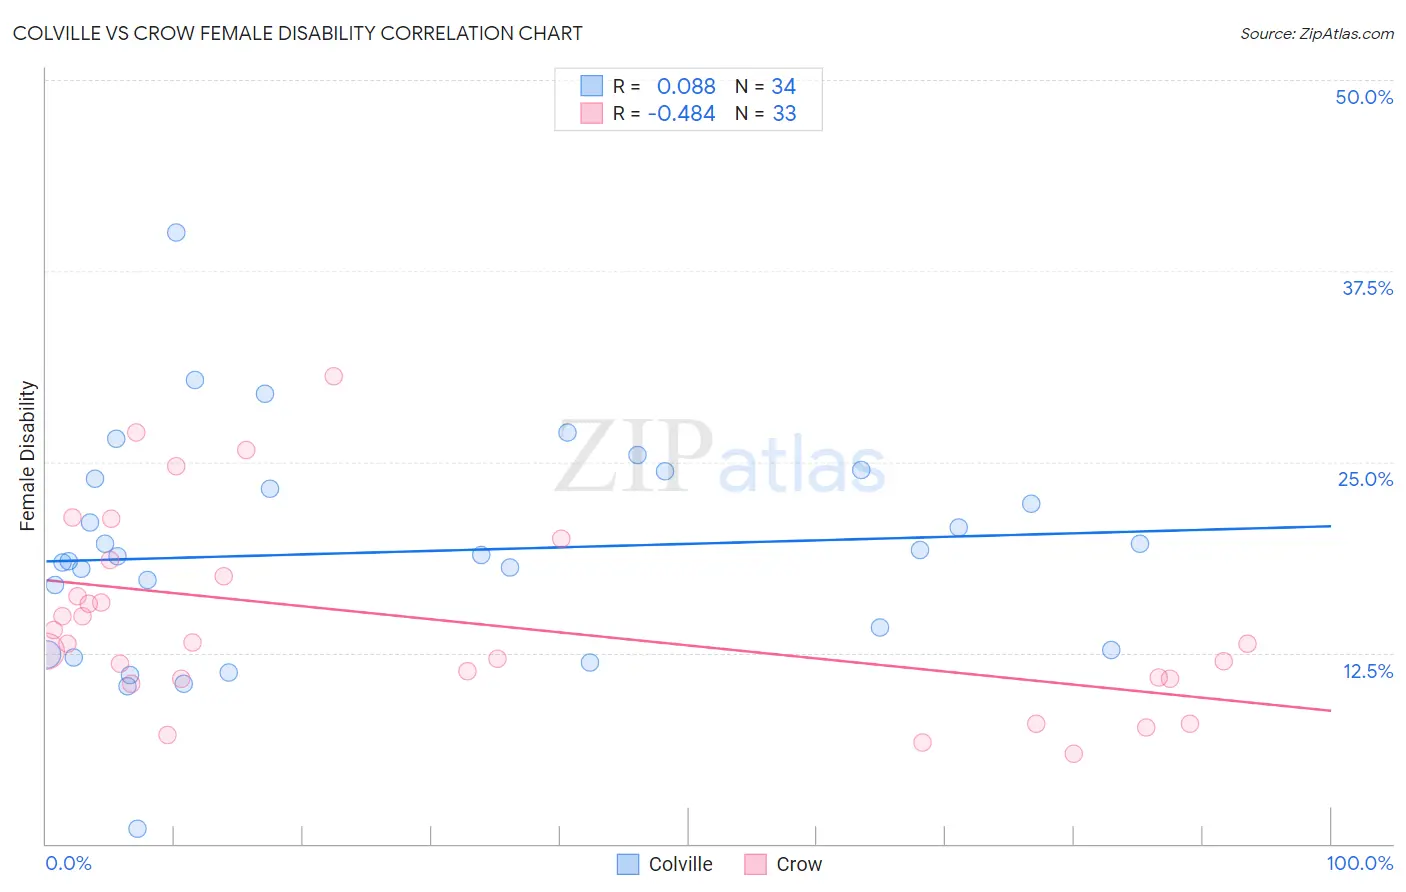
Colville vs Crow Female Disability Correlation Chart
The statistical analysis conducted on geographies consisting of 34,687,480 people shows a slight positive correlation between the proportion of Colville and percentage of females with a disability in the United States with a correlation coefficient (R) of 0.088 and weighted average of 15.1%. Similarly, the statistical analysis conducted on geographies consisting of 59,203,851 people shows a moderate negative correlation between the proportion of Crow and percentage of females with a disability in the United States with a correlation coefficient (R) of -0.484 and weighted average of 12.7%, a difference of 18.9%.
Female Disability Correlation Summary
| Measurement | Colville | Crow |
| Minimum | 0.95% | 5.9% |
| Maximum | 40.0% | 30.6% |
| Range | 39.1% | 24.7% |
| Mean | 19.1% | 14.6% |
| Median | 18.9% | 13.1% |
| Interquartile 25% (IQ1) | 12.7% | 10.8% |
| Interquartile 75% (IQ3) | 23.9% | 18.0% |
| Interquartile Range (IQR) | 11.3% | 7.2% |
| Standard Deviation (Sample) | 7.3% | 6.2% |
| Standard Deviation (Population) | 7.2% | 6.1% |
Similar Demographics by Female Disability
Demographics Similar to Colville by Female Disability
In terms of female disability, the demographic groups most similar to Colville are Dutch West Indian (15.0%, a difference of 0.40%), Tohono O'odham (15.0%, a difference of 0.55%), Seminole (15.0%, a difference of 0.67%), Chickasaw (15.2%, a difference of 0.95%), and Cajun (14.9%, a difference of 1.3%).
| Demographics | Rating | Rank | Female Disability |
| Pima | 0.0 /100 | #332 | Tragic 14.8% |
| Immigrants | Azores | 0.0 /100 | #333 | Tragic 14.9% |
| Cherokee | 0.0 /100 | #334 | Tragic 14.9% |
| Cajuns | 0.0 /100 | #335 | Tragic 14.9% |
| Seminole | 0.0 /100 | #336 | Tragic 15.0% |
| Tohono O'odham | 0.0 /100 | #337 | Tragic 15.0% |
| Dutch West Indians | 0.0 /100 | #338 | Tragic 15.0% |
| Colville | 0.0 /100 | #339 | Tragic 15.1% |
| Chickasaw | 0.0 /100 | #340 | Tragic 15.2% |
| Choctaw | 0.0 /100 | #341 | Tragic 15.4% |
| Creek | 0.0 /100 | #342 | Tragic 15.7% |
| Lumbee | 0.0 /100 | #343 | Tragic 15.8% |
| Kiowa | 0.0 /100 | #344 | Tragic 15.8% |
| Puerto Ricans | 0.0 /100 | #345 | Tragic 16.6% |
| Tsimshian | 0.0 /100 | #346 | Tragic 16.8% |
Demographics Similar to Crow by Female Disability
In terms of female disability, the demographic groups most similar to Crow are Slovene (12.7%, a difference of 0.060%), Immigrants from Caribbean (12.7%, a difference of 0.080%), Jamaican (12.7%, a difference of 0.090%), Immigrants from Congo (12.7%, a difference of 0.10%), and Hawaiian (12.7%, a difference of 0.12%).
| Demographics | Rating | Rank | Female Disability |
| Alsatians | 2.5 /100 | #244 | Tragic 12.6% |
| Immigrants | Jamaica | 2.2 /100 | #245 | Tragic 12.6% |
| Spanish American Indians | 2.1 /100 | #246 | Tragic 12.6% |
| Menominee | 2.1 /100 | #247 | Tragic 12.6% |
| Carpatho Rusyns | 2.0 /100 | #248 | Tragic 12.6% |
| Immigrants | Congo | 1.8 /100 | #249 | Tragic 12.7% |
| Slovenes | 1.7 /100 | #250 | Tragic 12.7% |
| Crow | 1.6 /100 | #251 | Tragic 12.7% |
| Immigrants | Caribbean | 1.4 /100 | #252 | Tragic 12.7% |
| Jamaicans | 1.4 /100 | #253 | Tragic 12.7% |
| Hawaiians | 1.4 /100 | #254 | Tragic 12.7% |
| Immigrants | Germany | 1.3 /100 | #255 | Tragic 12.7% |
| British West Indians | 1.2 /100 | #256 | Tragic 12.7% |
| Liberians | 1.1 /100 | #257 | Tragic 12.7% |
| Aleuts | 1.1 /100 | #258 | Tragic 12.7% |