Moroccan vs Crow Child Poverty Among Boys Under 16
COMPARE
Moroccan
Crow
Child Poverty Among Boys Under 16
Child Poverty Among Boys Under 16 Comparison
Moroccans
Crow
17.7%
CHILD POVERTY AMONG BOYS UNDER 16
5.6/ 100
METRIC RATING
216th/ 347
METRIC RANK
26.3%
CHILD POVERTY AMONG BOYS UNDER 16
0.0/ 100
METRIC RATING
340th/ 347
METRIC RANK
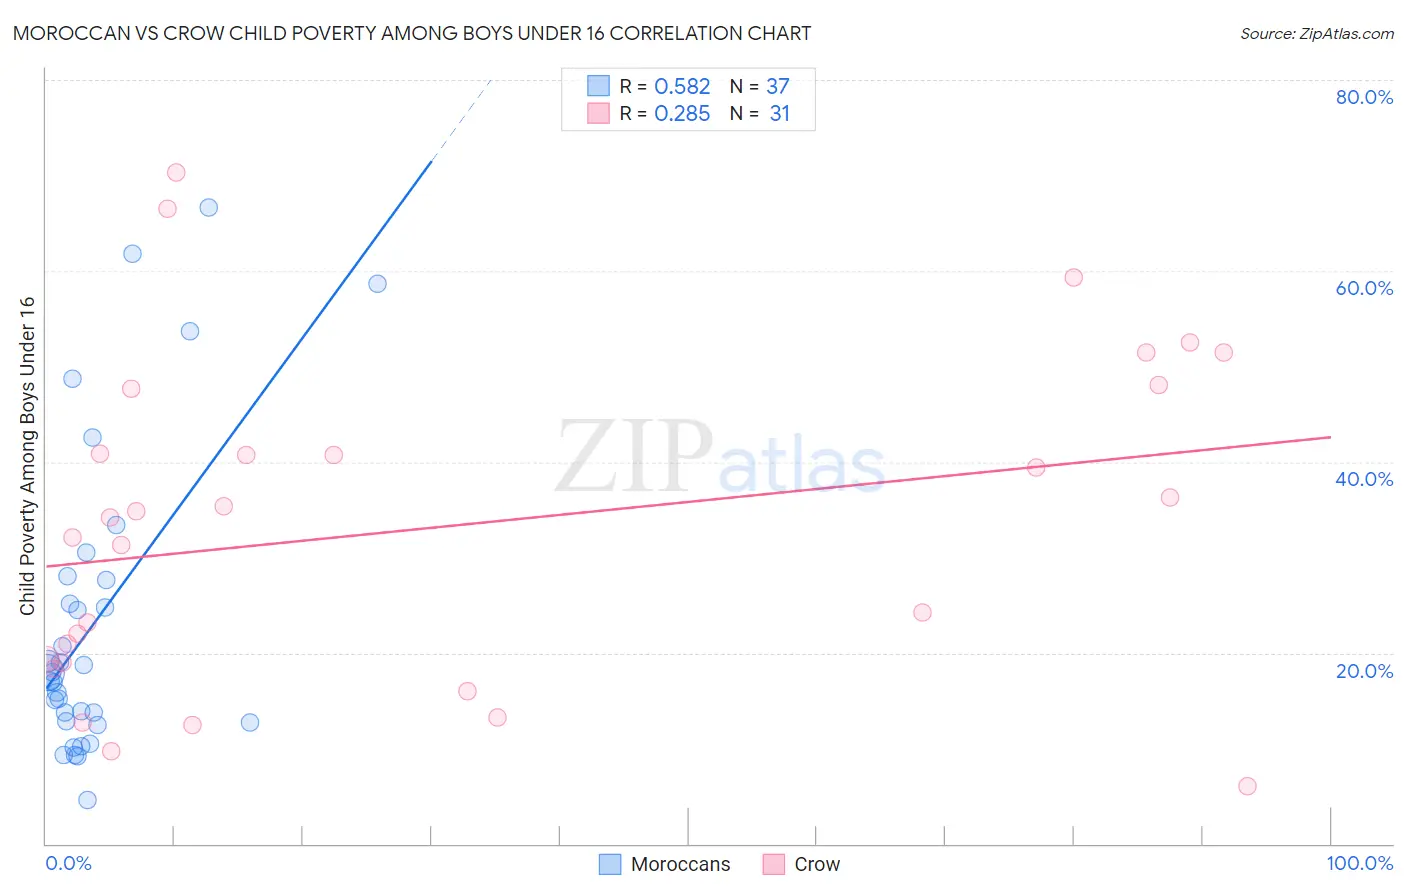
Moroccan vs Crow Child Poverty Among Boys Under 16 Correlation Chart
The statistical analysis conducted on geographies consisting of 200,157,995 people shows a substantial positive correlation between the proportion of Moroccans and poverty level among boys under the age of 16 in the United States with a correlation coefficient (R) of 0.582 and weighted average of 17.7%. Similarly, the statistical analysis conducted on geographies consisting of 59,088,191 people shows a weak positive correlation between the proportion of Crow and poverty level among boys under the age of 16 in the United States with a correlation coefficient (R) of 0.285 and weighted average of 26.3%, a difference of 48.1%.
Child Poverty Among Boys Under 16 Correlation Summary
| Measurement | Moroccan | Crow |
| Minimum | 4.6% | 6.1% |
| Maximum | 66.7% | 70.3% |
| Range | 62.1% | 64.2% |
| Mean | 23.3% | 33.2% |
| Median | 17.9% | 34.2% |
| Interquartile 25% (IQ1) | 12.8% | 19.0% |
| Interquartile 75% (IQ3) | 27.8% | 47.6% |
| Interquartile Range (IQR) | 15.1% | 28.6% |
| Standard Deviation (Sample) | 16.0% | 17.1% |
| Standard Deviation (Population) | 15.8% | 16.8% |
Similar Demographics by Child Poverty Among Boys Under 16
Demographics Similar to Moroccans by Child Poverty Among Boys Under 16
In terms of child poverty among boys under 16, the demographic groups most similar to Moroccans are Japanese (17.7%, a difference of 0.030%), Iraqi (17.7%, a difference of 0.050%), Osage (17.7%, a difference of 0.090%), Sierra Leonean (17.8%, a difference of 0.13%), and Panamanian (17.7%, a difference of 0.16%).
| Demographics | Rating | Rank | Child Poverty Among Boys Under 16 |
| Alaskan Athabascans | 7.3 /100 | #209 | Tragic 17.6% |
| Immigrants | Armenia | 6.8 /100 | #210 | Tragic 17.6% |
| Immigrants | Immigrants | 6.7 /100 | #211 | Tragic 17.6% |
| Aleuts | 6.6 /100 | #212 | Tragic 17.7% |
| Immigrants | Eastern Africa | 6.0 /100 | #213 | Tragic 17.7% |
| Panamanians | 5.9 /100 | #214 | Tragic 17.7% |
| Osage | 5.8 /100 | #215 | Tragic 17.7% |
| Moroccans | 5.6 /100 | #216 | Tragic 17.7% |
| Japanese | 5.5 /100 | #217 | Tragic 17.7% |
| Iraqis | 5.5 /100 | #218 | Tragic 17.7% |
| Sierra Leoneans | 5.3 /100 | #219 | Tragic 17.8% |
| Immigrants | Cambodia | 5.1 /100 | #220 | Tragic 17.8% |
| Immigrants | Panama | 4.3 /100 | #221 | Tragic 17.9% |
| Pennsylvania Germans | 3.9 /100 | #222 | Tragic 17.9% |
| Cubans | 3.8 /100 | #223 | Tragic 17.9% |
Demographics Similar to Crow by Child Poverty Among Boys Under 16
In terms of child poverty among boys under 16, the demographic groups most similar to Crow are Houma (26.2%, a difference of 0.16%), Hopi (25.9%, a difference of 1.2%), Cheyenne (25.8%, a difference of 1.7%), Sioux (25.3%, a difference of 3.8%), and Yup'ik (24.7%, a difference of 6.1%).
| Demographics | Rating | Rank | Child Poverty Among Boys Under 16 |
| Apache | 0.0 /100 | #333 | Tragic 24.5% |
| Blacks/African Americans | 0.0 /100 | #334 | Tragic 24.5% |
| Yup'ik | 0.0 /100 | #335 | Tragic 24.7% |
| Sioux | 0.0 /100 | #336 | Tragic 25.3% |
| Cheyenne | 0.0 /100 | #337 | Tragic 25.8% |
| Hopi | 0.0 /100 | #338 | Tragic 25.9% |
| Houma | 0.0 /100 | #339 | Tragic 26.2% |
| Crow | 0.0 /100 | #340 | Tragic 26.3% |
| Immigrants | Yemen | 0.0 /100 | #341 | Tragic 28.9% |
| Pima | 0.0 /100 | #342 | Tragic 29.7% |
| Navajo | 0.0 /100 | #343 | Tragic 30.3% |
| Yuman | 0.0 /100 | #344 | Tragic 30.6% |
| Tohono O'odham | 0.0 /100 | #345 | Tragic 31.6% |
| Lumbee | 0.0 /100 | #346 | Tragic 31.9% |
| Puerto Ricans | 0.0 /100 | #347 | Tragic 32.8% |