Puerto Rican vs Yakama Cognitive Disability
COMPARE
Puerto Rican
Yakama
Cognitive Disability
Cognitive Disability Comparison
Puerto Ricans
Yakama
19.2%
COGNITIVE DISABILITY
0.0/ 100
METRIC RATING
339th/ 347
METRIC RANK
18.1%
COGNITIVE DISABILITY
0.1/ 100
METRIC RATING
281st/ 347
METRIC RANK
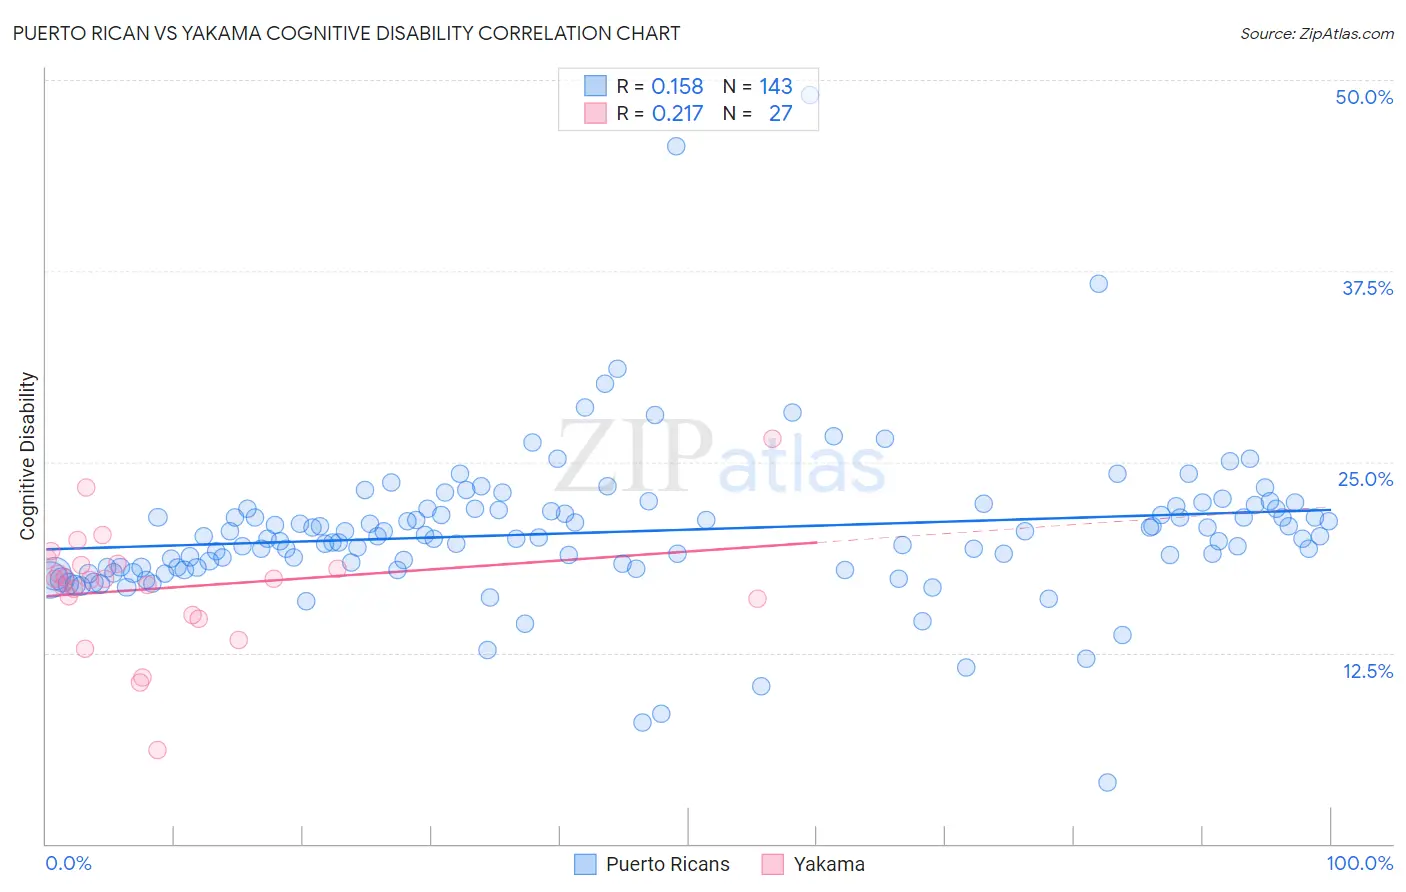
Puerto Rican vs Yakama Cognitive Disability Correlation Chart
The statistical analysis conducted on geographies consisting of 528,170,098 people shows a poor positive correlation between the proportion of Puerto Ricans and percentage of population with cognitive disability in the United States with a correlation coefficient (R) of 0.158 and weighted average of 19.2%. Similarly, the statistical analysis conducted on geographies consisting of 19,917,879 people shows a weak positive correlation between the proportion of Yakama and percentage of population with cognitive disability in the United States with a correlation coefficient (R) of 0.217 and weighted average of 18.1%, a difference of 6.1%.
Cognitive Disability Correlation Summary
| Measurement | Puerto Rican | Yakama |
| Minimum | 4.0% | 6.1% |
| Maximum | 49.0% | 26.5% |
| Range | 44.9% | 20.4% |
| Mean | 20.4% | 16.8% |
| Median | 20.1% | 17.3% |
| Interquartile 25% (IQ1) | 18.1% | 15.0% |
| Interquartile 75% (IQ3) | 21.9% | 18.3% |
| Interquartile Range (IQR) | 3.8% | 3.3% |
| Standard Deviation (Sample) | 5.2% | 3.9% |
| Standard Deviation (Population) | 5.1% | 3.8% |
Similar Demographics by Cognitive Disability
Demographics Similar to Puerto Ricans by Cognitive Disability
In terms of cognitive disability, the demographic groups most similar to Puerto Ricans are Cape Verdean (19.2%, a difference of 0.020%), Tohono O'odham (19.3%, a difference of 0.26%), Houma (19.3%, a difference of 0.26%), Lumbee (19.1%, a difference of 0.47%), and Immigrants from Saudi Arabia (19.1%, a difference of 0.82%).
| Demographics | Rating | Rank | Cognitive Disability |
| Immigrants | Sudan | 0.0 /100 | #332 | Tragic 18.8% |
| Immigrants | Yemen | 0.0 /100 | #333 | Tragic 18.8% |
| Sudanese | 0.0 /100 | #334 | Tragic 18.9% |
| Senegalese | 0.0 /100 | #335 | Tragic 19.0% |
| Blacks/African Americans | 0.0 /100 | #336 | Tragic 19.0% |
| Immigrants | Saudi Arabia | 0.0 /100 | #337 | Tragic 19.1% |
| Lumbee | 0.0 /100 | #338 | Tragic 19.1% |
| Puerto Ricans | 0.0 /100 | #339 | Tragic 19.2% |
| Cape Verdeans | 0.0 /100 | #340 | Tragic 19.2% |
| Tohono O'odham | 0.0 /100 | #341 | Tragic 19.3% |
| Houma | 0.0 /100 | #342 | Tragic 19.3% |
| Immigrants | Zaire | 0.0 /100 | #343 | Tragic 19.4% |
| Immigrants | Congo | 0.0 /100 | #344 | Tragic 19.7% |
| Somalis | 0.0 /100 | #345 | Tragic 19.8% |
| Immigrants | Cabo Verde | 0.0 /100 | #346 | Tragic 19.9% |
Demographics Similar to Yakama by Cognitive Disability
In terms of cognitive disability, the demographic groups most similar to Yakama are Immigrants from Cambodia (18.1%, a difference of 0.020%), Nigerian (18.1%, a difference of 0.050%), Immigrants from Uganda (18.1%, a difference of 0.090%), Bermudan (18.1%, a difference of 0.10%), and West Indian (18.1%, a difference of 0.12%).
| Demographics | Rating | Rank | Cognitive Disability |
| Immigrants | Nigeria | 0.2 /100 | #274 | Tragic 18.0% |
| Immigrants | Laos | 0.2 /100 | #275 | Tragic 18.1% |
| Yuman | 0.2 /100 | #276 | Tragic 18.1% |
| Immigrants | Kuwait | 0.2 /100 | #277 | Tragic 18.1% |
| Immigrants | Micronesia | 0.2 /100 | #278 | Tragic 18.1% |
| Chippewa | 0.1 /100 | #279 | Tragic 18.1% |
| West Indians | 0.1 /100 | #280 | Tragic 18.1% |
| Yakama | 0.1 /100 | #281 | Tragic 18.1% |
| Immigrants | Cambodia | 0.1 /100 | #282 | Tragic 18.1% |
| Nigerians | 0.1 /100 | #283 | Tragic 18.1% |
| Immigrants | Uganda | 0.1 /100 | #284 | Tragic 18.1% |
| Bermudans | 0.1 /100 | #285 | Tragic 18.1% |
| Kenyans | 0.1 /100 | #286 | Tragic 18.1% |
| Dutch West Indians | 0.1 /100 | #287 | Tragic 18.1% |
| Immigrants | West Indies | 0.1 /100 | #288 | Tragic 18.1% |