Slavic vs Yakama Cognitive Disability
COMPARE
Slavic
Yakama
Cognitive Disability
Cognitive Disability Comparison
Slavs
Yakama
16.7%
COGNITIVE DISABILITY
99.3/ 100
METRIC RATING
74th/ 347
METRIC RANK
18.1%
COGNITIVE DISABILITY
0.1/ 100
METRIC RATING
281st/ 347
METRIC RANK
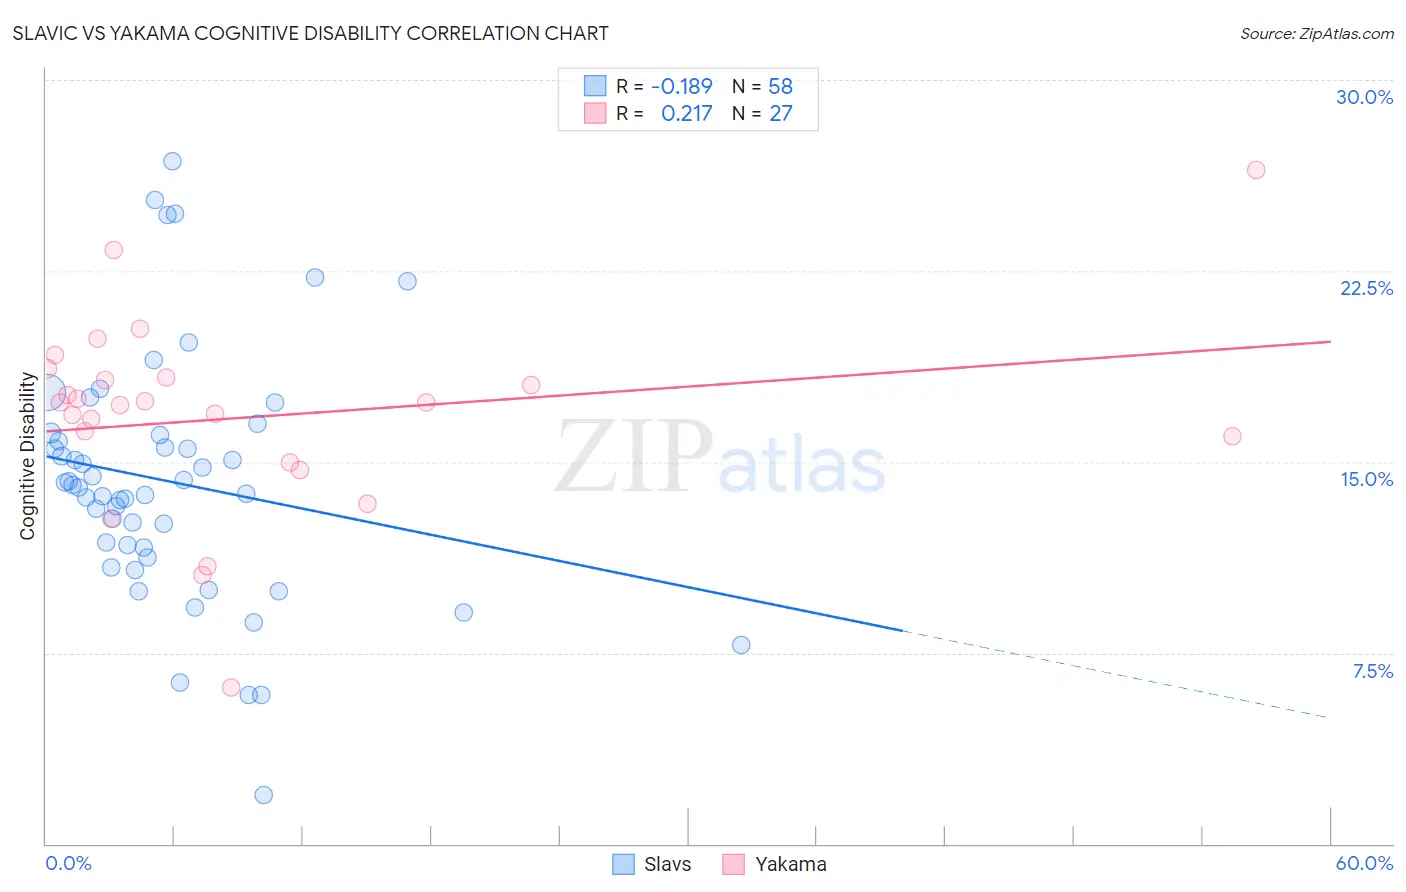
Slavic vs Yakama Cognitive Disability Correlation Chart
The statistical analysis conducted on geographies consisting of 270,861,069 people shows a poor negative correlation between the proportion of Slavs and percentage of population with cognitive disability in the United States with a correlation coefficient (R) of -0.189 and weighted average of 16.7%. Similarly, the statistical analysis conducted on geographies consisting of 19,917,879 people shows a weak positive correlation between the proportion of Yakama and percentage of population with cognitive disability in the United States with a correlation coefficient (R) of 0.217 and weighted average of 18.1%, a difference of 8.6%.
Cognitive Disability Correlation Summary
| Measurement | Slavic | Yakama |
| Minimum | 1.9% | 6.1% |
| Maximum | 26.8% | 26.5% |
| Range | 24.9% | 20.4% |
| Mean | 14.2% | 16.8% |
| Median | 14.0% | 17.3% |
| Interquartile 25% (IQ1) | 11.6% | 15.0% |
| Interquartile 75% (IQ3) | 16.0% | 18.3% |
| Interquartile Range (IQR) | 4.4% | 3.3% |
| Standard Deviation (Sample) | 4.9% | 3.9% |
| Standard Deviation (Population) | 4.8% | 3.8% |
Similar Demographics by Cognitive Disability
Demographics Similar to Slavs by Cognitive Disability
In terms of cognitive disability, the demographic groups most similar to Slavs are Burmese (16.7%, a difference of 0.0%), German (16.7%, a difference of 0.010%), Estonian (16.7%, a difference of 0.010%), Immigrants from Sweden (16.7%, a difference of 0.030%), and Immigrants from Belgium (16.7%, a difference of 0.030%).
| Demographics | Rating | Rank | Cognitive Disability |
| Latvians | 99.5 /100 | #67 | Exceptional 16.6% |
| Ukrainians | 99.4 /100 | #68 | Exceptional 16.6% |
| Immigrants | Uzbekistan | 99.4 /100 | #69 | Exceptional 16.7% |
| Immigrants | Sweden | 99.4 /100 | #70 | Exceptional 16.7% |
| Immigrants | Belgium | 99.3 /100 | #71 | Exceptional 16.7% |
| Germans | 99.3 /100 | #72 | Exceptional 16.7% |
| Burmese | 99.3 /100 | #73 | Exceptional 16.7% |
| Slavs | 99.3 /100 | #74 | Exceptional 16.7% |
| Estonians | 99.3 /100 | #75 | Exceptional 16.7% |
| Immigrants | Serbia | 99.3 /100 | #76 | Exceptional 16.7% |
| Immigrants | Hungary | 99.3 /100 | #77 | Exceptional 16.7% |
| Peruvians | 99.3 /100 | #78 | Exceptional 16.7% |
| Immigrants | Bulgaria | 99.3 /100 | #79 | Exceptional 16.7% |
| Egyptians | 99.2 /100 | #80 | Exceptional 16.7% |
| Immigrants | Netherlands | 99.2 /100 | #81 | Exceptional 16.7% |
Demographics Similar to Yakama by Cognitive Disability
In terms of cognitive disability, the demographic groups most similar to Yakama are Immigrants from Cambodia (18.1%, a difference of 0.020%), Nigerian (18.1%, a difference of 0.050%), Immigrants from Uganda (18.1%, a difference of 0.090%), Bermudan (18.1%, a difference of 0.10%), and West Indian (18.1%, a difference of 0.12%).
| Demographics | Rating | Rank | Cognitive Disability |
| Immigrants | Nigeria | 0.2 /100 | #274 | Tragic 18.0% |
| Immigrants | Laos | 0.2 /100 | #275 | Tragic 18.1% |
| Yuman | 0.2 /100 | #276 | Tragic 18.1% |
| Immigrants | Kuwait | 0.2 /100 | #277 | Tragic 18.1% |
| Immigrants | Micronesia | 0.2 /100 | #278 | Tragic 18.1% |
| Chippewa | 0.1 /100 | #279 | Tragic 18.1% |
| West Indians | 0.1 /100 | #280 | Tragic 18.1% |
| Yakama | 0.1 /100 | #281 | Tragic 18.1% |
| Immigrants | Cambodia | 0.1 /100 | #282 | Tragic 18.1% |
| Nigerians | 0.1 /100 | #283 | Tragic 18.1% |
| Immigrants | Uganda | 0.1 /100 | #284 | Tragic 18.1% |
| Bermudans | 0.1 /100 | #285 | Tragic 18.1% |
| Kenyans | 0.1 /100 | #286 | Tragic 18.1% |
| Dutch West Indians | 0.1 /100 | #287 | Tragic 18.1% |
| Immigrants | West Indies | 0.1 /100 | #288 | Tragic 18.1% |