Bangladeshi vs Immigrants from Netherlands Cognitive Disability
COMPARE
Bangladeshi
Immigrants from Netherlands
Cognitive Disability
Cognitive Disability Comparison
Bangladeshis
Immigrants from Netherlands
18.6%
COGNITIVE DISABILITY
0.0/ 100
METRIC RATING
318th/ 347
METRIC RANK
16.7%
COGNITIVE DISABILITY
99.2/ 100
METRIC RATING
81st/ 347
METRIC RANK
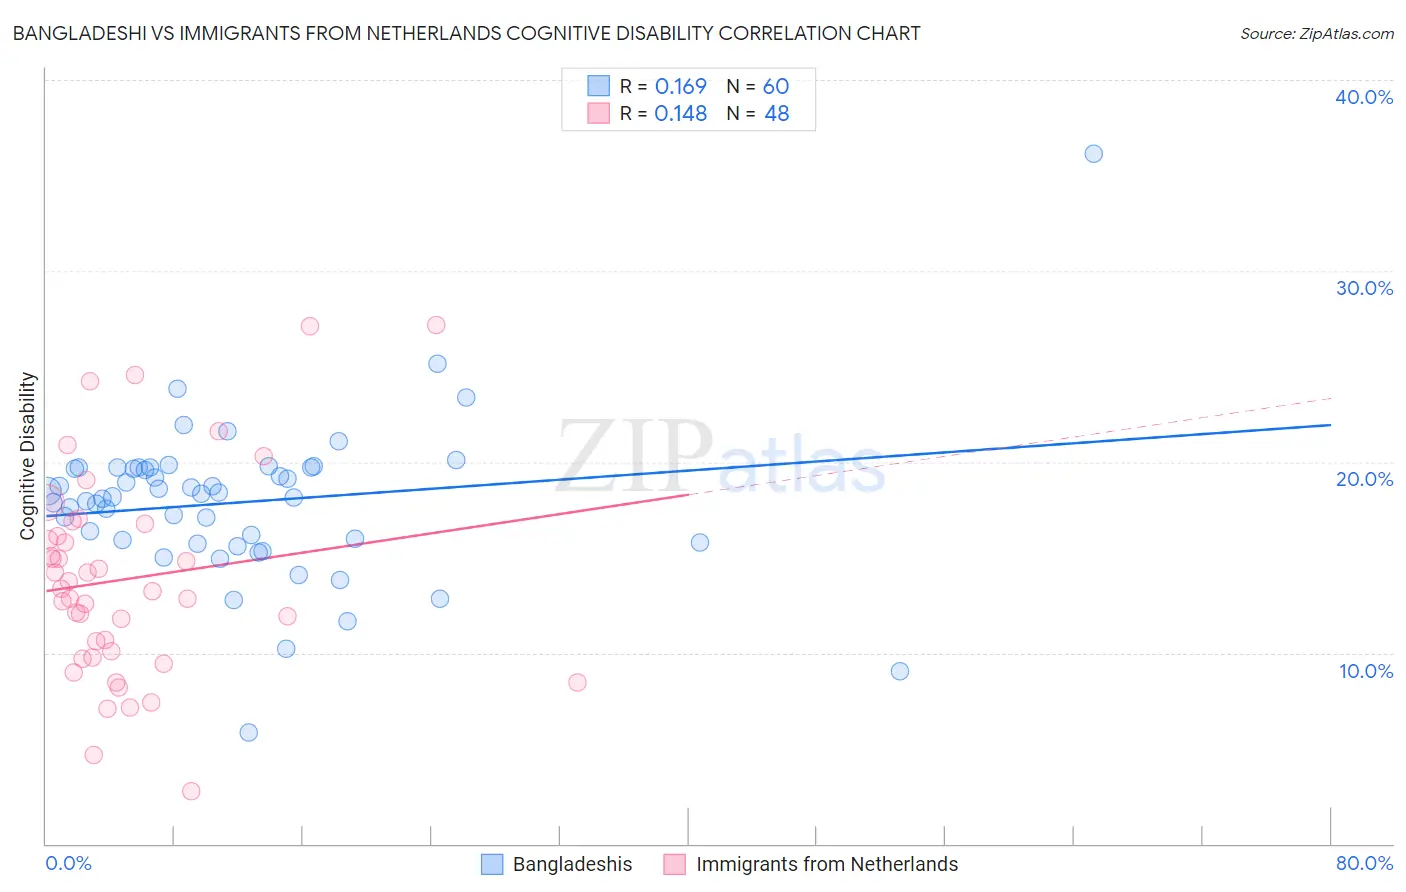
Bangladeshi vs Immigrants from Netherlands Cognitive Disability Correlation Chart
The statistical analysis conducted on geographies consisting of 141,390,027 people shows a poor positive correlation between the proportion of Bangladeshis and percentage of population with cognitive disability in the United States with a correlation coefficient (R) of 0.169 and weighted average of 18.6%. Similarly, the statistical analysis conducted on geographies consisting of 237,879,934 people shows a poor positive correlation between the proportion of Immigrants from Netherlands and percentage of population with cognitive disability in the United States with a correlation coefficient (R) of 0.148 and weighted average of 16.7%, a difference of 11.6%.
Cognitive Disability Correlation Summary
| Measurement | Bangladeshi | Immigrants from Netherlands |
| Minimum | 5.8% | 2.7% |
| Maximum | 36.1% | 27.2% |
| Range | 30.3% | 24.4% |
| Mean | 17.9% | 13.9% |
| Median | 18.3% | 13.3% |
| Interquartile 25% (IQ1) | 15.9% | 9.9% |
| Interquartile 75% (IQ3) | 19.7% | 16.5% |
| Interquartile Range (IQR) | 3.8% | 6.6% |
| Standard Deviation (Sample) | 4.1% | 5.4% |
| Standard Deviation (Population) | 4.1% | 5.4% |
Similar Demographics by Cognitive Disability
Demographics Similar to Bangladeshis by Cognitive Disability
In terms of cognitive disability, the demographic groups most similar to Bangladeshis are Comanche (18.6%, a difference of 0.040%), Apache (18.6%, a difference of 0.080%), Liberian (18.6%, a difference of 0.12%), African (18.6%, a difference of 0.17%), and Immigrants from Middle Africa (18.6%, a difference of 0.20%).
| Demographics | Rating | Rank | Cognitive Disability |
| Hmong | 0.0 /100 | #311 | Tragic 18.4% |
| Chickasaw | 0.0 /100 | #312 | Tragic 18.5% |
| Yaqui | 0.0 /100 | #313 | Tragic 18.5% |
| Sub-Saharan Africans | 0.0 /100 | #314 | Tragic 18.5% |
| Immigrants | Dominica | 0.0 /100 | #315 | Tragic 18.6% |
| Immigrants | Middle Africa | 0.0 /100 | #316 | Tragic 18.6% |
| Liberians | 0.0 /100 | #317 | Tragic 18.6% |
| Bangladeshis | 0.0 /100 | #318 | Tragic 18.6% |
| Comanche | 0.0 /100 | #319 | Tragic 18.6% |
| Apache | 0.0 /100 | #320 | Tragic 18.6% |
| Africans | 0.0 /100 | #321 | Tragic 18.6% |
| Immigrants | Liberia | 0.0 /100 | #322 | Tragic 18.7% |
| Pueblo | 0.0 /100 | #323 | Tragic 18.7% |
| Dominicans | 0.0 /100 | #324 | Tragic 18.7% |
| Indonesians | 0.0 /100 | #325 | Tragic 18.7% |
Demographics Similar to Immigrants from Netherlands by Cognitive Disability
In terms of cognitive disability, the demographic groups most similar to Immigrants from Netherlands are Egyptian (16.7%, a difference of 0.010%), Swiss (16.7%, a difference of 0.030%), Peruvian (16.7%, a difference of 0.040%), Immigrants from Bulgaria (16.7%, a difference of 0.040%), and Immigrants from Hungary (16.7%, a difference of 0.050%).
| Demographics | Rating | Rank | Cognitive Disability |
| Slavs | 99.3 /100 | #74 | Exceptional 16.7% |
| Estonians | 99.3 /100 | #75 | Exceptional 16.7% |
| Immigrants | Serbia | 99.3 /100 | #76 | Exceptional 16.7% |
| Immigrants | Hungary | 99.3 /100 | #77 | Exceptional 16.7% |
| Peruvians | 99.3 /100 | #78 | Exceptional 16.7% |
| Immigrants | Bulgaria | 99.3 /100 | #79 | Exceptional 16.7% |
| Egyptians | 99.2 /100 | #80 | Exceptional 16.7% |
| Immigrants | Netherlands | 99.2 /100 | #81 | Exceptional 16.7% |
| Swiss | 99.2 /100 | #82 | Exceptional 16.7% |
| Serbians | 99.1 /100 | #83 | Exceptional 16.7% |
| Belgians | 99.1 /100 | #84 | Exceptional 16.7% |
| Immigrants | Moldova | 99.1 /100 | #85 | Exceptional 16.7% |
| Immigrants | South Africa | 99.0 /100 | #86 | Exceptional 16.7% |
| Native Hawaiians | 99.0 /100 | #87 | Exceptional 16.7% |
| Immigrants | Philippines | 99.0 /100 | #88 | Exceptional 16.7% |