German vs Immigrants from Kuwait Ambulatory Disability
COMPARE
German
Immigrants from Kuwait
Ambulatory Disability
Ambulatory Disability Comparison
Germans
Immigrants from Kuwait
6.5%
AMBULATORY DISABILITY
1.5/ 100
METRIC RATING
243rd/ 347
METRIC RANK
5.4%
AMBULATORY DISABILITY
100.0/ 100
METRIC RATING
21st/ 347
METRIC RANK
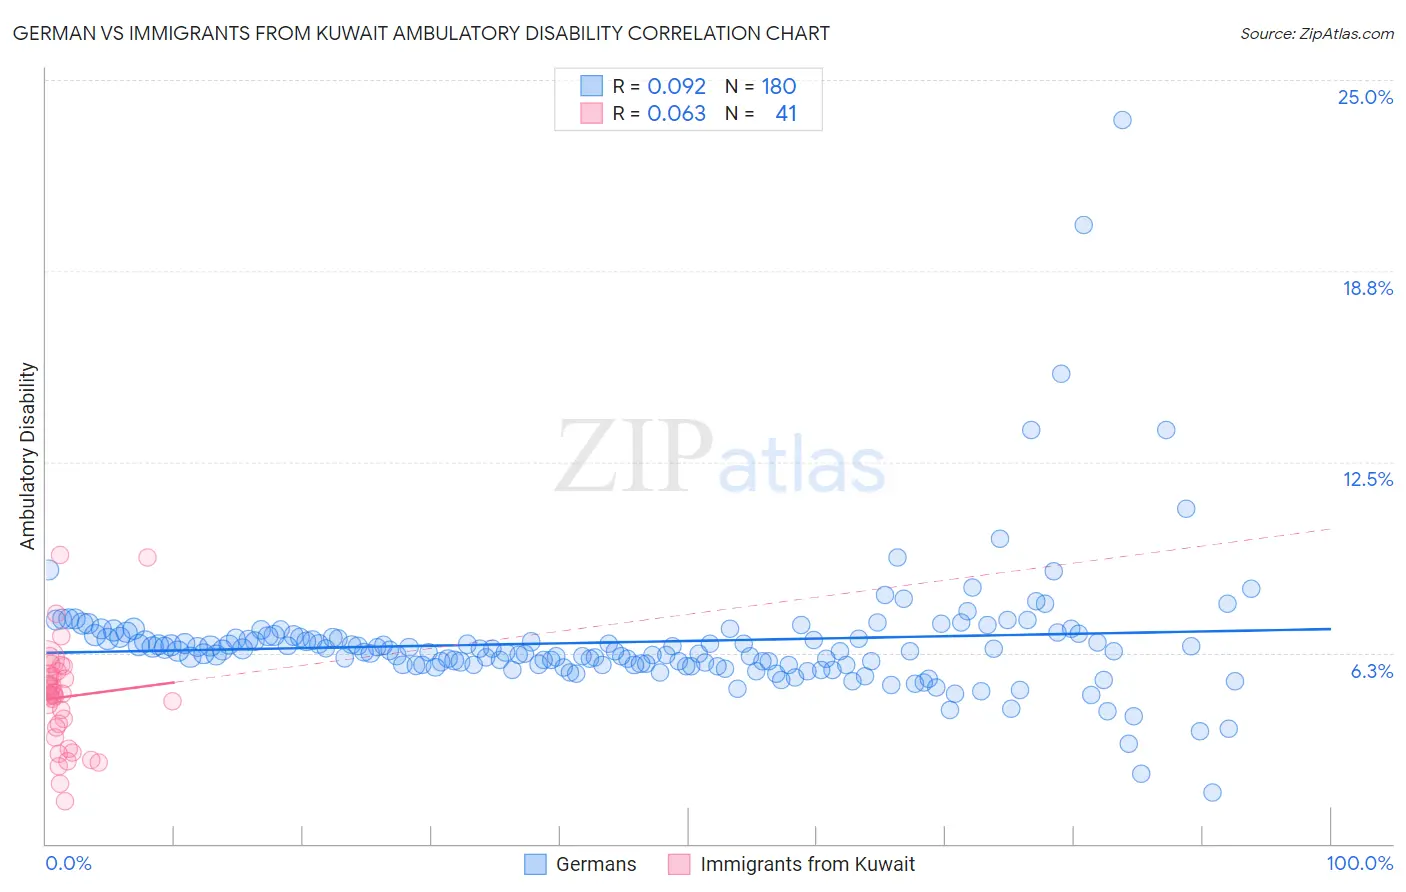
German vs Immigrants from Kuwait Ambulatory Disability Correlation Chart
The statistical analysis conducted on geographies consisting of 580,433,029 people shows a slight positive correlation between the proportion of Germans and percentage of population with ambulatory disability in the United States with a correlation coefficient (R) of 0.092 and weighted average of 6.5%. Similarly, the statistical analysis conducted on geographies consisting of 136,900,049 people shows a slight positive correlation between the proportion of Immigrants from Kuwait and percentage of population with ambulatory disability in the United States with a correlation coefficient (R) of 0.063 and weighted average of 5.4%, a difference of 20.4%.
Ambulatory Disability Correlation Summary
| Measurement | German | Immigrants from Kuwait |
| Minimum | 1.7% | 1.4% |
| Maximum | 23.7% | 9.4% |
| Range | 22.0% | 8.1% |
| Mean | 6.6% | 4.8% |
| Median | 6.3% | 4.9% |
| Interquartile 25% (IQ1) | 5.9% | 3.6% |
| Interquartile 75% (IQ3) | 6.8% | 5.6% |
| Interquartile Range (IQR) | 0.93% | 1.9% |
| Standard Deviation (Sample) | 2.2% | 1.7% |
| Standard Deviation (Population) | 2.2% | 1.7% |
Similar Demographics by Ambulatory Disability
Demographics Similar to Germans by Ambulatory Disability
In terms of ambulatory disability, the demographic groups most similar to Germans are Immigrants from Panama (6.5%, a difference of 0.0%), Spaniard (6.5%, a difference of 0.020%), Tlingit-Haida (6.5%, a difference of 0.040%), Immigrants from Haiti (6.5%, a difference of 0.050%), and Armenian (6.5%, a difference of 0.050%).
| Demographics | Rating | Rank | Ambulatory Disability |
| Dutch | 2.0 /100 | #236 | Tragic 6.4% |
| Immigrants | Germany | 1.8 /100 | #237 | Tragic 6.4% |
| Haitians | 1.8 /100 | #238 | Tragic 6.4% |
| Senegalese | 1.7 /100 | #239 | Tragic 6.4% |
| Immigrants | Senegal | 1.7 /100 | #240 | Tragic 6.4% |
| Immigrants | Haiti | 1.6 /100 | #241 | Tragic 6.5% |
| Spaniards | 1.6 /100 | #242 | Tragic 6.5% |
| Germans | 1.5 /100 | #243 | Tragic 6.5% |
| Immigrants | Panama | 1.5 /100 | #244 | Tragic 6.5% |
| Tlingit-Haida | 1.5 /100 | #245 | Tragic 6.5% |
| Armenians | 1.5 /100 | #246 | Tragic 6.5% |
| Immigrants | Cuba | 1.4 /100 | #247 | Tragic 6.5% |
| Immigrants | Portugal | 1.4 /100 | #248 | Tragic 6.5% |
| Native Hawaiians | 1.1 /100 | #249 | Tragic 6.5% |
| Chinese | 1.0 /100 | #250 | Tragic 6.5% |
Demographics Similar to Immigrants from Kuwait by Ambulatory Disability
In terms of ambulatory disability, the demographic groups most similar to Immigrants from Kuwait are Ethiopian (5.4%, a difference of 0.0%), Indian (Asian) (5.4%, a difference of 0.020%), Immigrants from Ethiopia (5.4%, a difference of 0.13%), Immigrants from Sri Lanka (5.4%, a difference of 0.13%), and Immigrants from Israel (5.4%, a difference of 0.37%).
| Demographics | Rating | Rank | Ambulatory Disability |
| Immigrants | Eastern Asia | 100.0 /100 | #14 | Exceptional 5.3% |
| Immigrants | China | 100.0 /100 | #15 | Exceptional 5.3% |
| Immigrants | Hong Kong | 100.0 /100 | #16 | Exceptional 5.3% |
| Immigrants | Ethiopia | 100.0 /100 | #17 | Exceptional 5.4% |
| Immigrants | Sri Lanka | 100.0 /100 | #18 | Exceptional 5.4% |
| Indians (Asian) | 100.0 /100 | #19 | Exceptional 5.4% |
| Ethiopians | 100.0 /100 | #20 | Exceptional 5.4% |
| Immigrants | Kuwait | 100.0 /100 | #21 | Exceptional 5.4% |
| Immigrants | Israel | 100.0 /100 | #22 | Exceptional 5.4% |
| Tongans | 100.0 /100 | #23 | Exceptional 5.4% |
| Immigrants | Saudi Arabia | 100.0 /100 | #24 | Exceptional 5.4% |
| Zimbabweans | 100.0 /100 | #25 | Exceptional 5.4% |
| Immigrants | Nepal | 100.0 /100 | #26 | Exceptional 5.4% |
| Asians | 100.0 /100 | #27 | Exceptional 5.4% |
| Cambodians | 100.0 /100 | #28 | Exceptional 5.4% |