Egyptian vs Croatian Cognitive Disability
COMPARE
Egyptian
Croatian
Cognitive Disability
Cognitive Disability Comparison
Egyptians
Croatians
16.7%
COGNITIVE DISABILITY
99.2/ 100
METRIC RATING
80th/ 347
METRIC RANK
16.4%
COGNITIVE DISABILITY
99.9/ 100
METRIC RATING
23rd/ 347
METRIC RANK
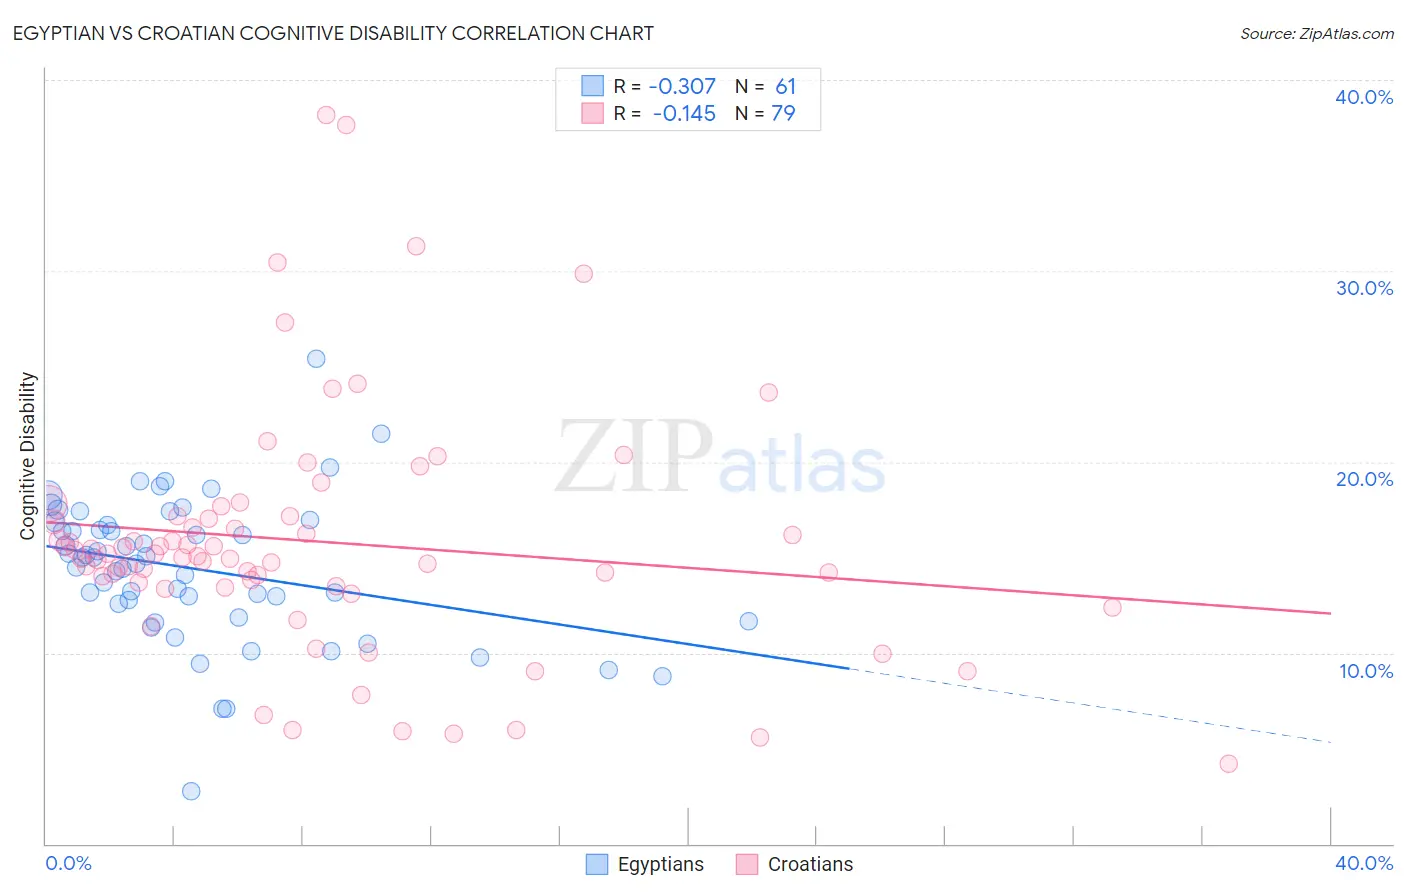
Egyptian vs Croatian Cognitive Disability Correlation Chart
The statistical analysis conducted on geographies consisting of 276,907,223 people shows a mild negative correlation between the proportion of Egyptians and percentage of population with cognitive disability in the United States with a correlation coefficient (R) of -0.307 and weighted average of 16.7%. Similarly, the statistical analysis conducted on geographies consisting of 375,711,663 people shows a poor negative correlation between the proportion of Croatians and percentage of population with cognitive disability in the United States with a correlation coefficient (R) of -0.145 and weighted average of 16.4%, a difference of 1.9%.
Cognitive Disability Correlation Summary
| Measurement | Egyptian | Croatian |
| Minimum | 2.7% | 4.2% |
| Maximum | 25.4% | 38.2% |
| Range | 22.7% | 34.0% |
| Mean | 14.4% | 15.8% |
| Median | 15.0% | 15.1% |
| Interquartile 25% (IQ1) | 12.2% | 13.5% |
| Interquartile 75% (IQ3) | 16.8% | 17.1% |
| Interquartile Range (IQR) | 4.6% | 3.6% |
| Standard Deviation (Sample) | 3.8% | 6.4% |
| Standard Deviation (Population) | 3.7% | 6.3% |
Similar Demographics by Cognitive Disability
Demographics Similar to Egyptians by Cognitive Disability
In terms of cognitive disability, the demographic groups most similar to Egyptians are Immigrants from Netherlands (16.7%, a difference of 0.010%), Peruvian (16.7%, a difference of 0.030%), Immigrants from Bulgaria (16.7%, a difference of 0.030%), Immigrants from Serbia (16.7%, a difference of 0.040%), and Immigrants from Hungary (16.7%, a difference of 0.040%).
| Demographics | Rating | Rank | Cognitive Disability |
| Burmese | 99.3 /100 | #73 | Exceptional 16.7% |
| Slavs | 99.3 /100 | #74 | Exceptional 16.7% |
| Estonians | 99.3 /100 | #75 | Exceptional 16.7% |
| Immigrants | Serbia | 99.3 /100 | #76 | Exceptional 16.7% |
| Immigrants | Hungary | 99.3 /100 | #77 | Exceptional 16.7% |
| Peruvians | 99.3 /100 | #78 | Exceptional 16.7% |
| Immigrants | Bulgaria | 99.3 /100 | #79 | Exceptional 16.7% |
| Egyptians | 99.2 /100 | #80 | Exceptional 16.7% |
| Immigrants | Netherlands | 99.2 /100 | #81 | Exceptional 16.7% |
| Swiss | 99.2 /100 | #82 | Exceptional 16.7% |
| Serbians | 99.1 /100 | #83 | Exceptional 16.7% |
| Belgians | 99.1 /100 | #84 | Exceptional 16.7% |
| Immigrants | Moldova | 99.1 /100 | #85 | Exceptional 16.7% |
| Immigrants | South Africa | 99.0 /100 | #86 | Exceptional 16.7% |
| Native Hawaiians | 99.0 /100 | #87 | Exceptional 16.7% |
Demographics Similar to Croatians by Cognitive Disability
In terms of cognitive disability, the demographic groups most similar to Croatians are Immigrants from South Central Asia (16.4%, a difference of 0.030%), Immigrants from Argentina (16.4%, a difference of 0.030%), Luxembourger (16.4%, a difference of 0.060%), Immigrants from Croatia (16.4%, a difference of 0.10%), and Immigrants from Pakistan (16.4%, a difference of 0.12%).
| Demographics | Rating | Rank | Cognitive Disability |
| Eastern Europeans | 100.0 /100 | #16 | Exceptional 16.3% |
| Immigrants | North Macedonia | 100.0 /100 | #17 | Exceptional 16.3% |
| Immigrants | Northern Europe | 100.0 /100 | #18 | Exceptional 16.3% |
| Immigrants | Bolivia | 100.0 /100 | #19 | Exceptional 16.3% |
| Bulgarians | 100.0 /100 | #20 | Exceptional 16.3% |
| Immigrants | Cuba | 100.0 /100 | #21 | Exceptional 16.3% |
| Immigrants | South Central Asia | 99.9 /100 | #22 | Exceptional 16.4% |
| Croatians | 99.9 /100 | #23 | Exceptional 16.4% |
| Immigrants | Argentina | 99.9 /100 | #24 | Exceptional 16.4% |
| Luxembourgers | 99.9 /100 | #25 | Exceptional 16.4% |
| Immigrants | Croatia | 99.9 /100 | #26 | Exceptional 16.4% |
| Immigrants | Pakistan | 99.9 /100 | #27 | Exceptional 16.4% |
| Poles | 99.9 /100 | #28 | Exceptional 16.4% |
| Filipinos | 99.9 /100 | #29 | Exceptional 16.4% |
| Czechs | 99.9 /100 | #30 | Exceptional 16.4% |