Mexican vs Sudanese Disability Age Under 5
COMPARE
Mexican
Sudanese
Disability Age Under 5
Disability Age Under 5 Comparison
Mexicans
Sudanese
1.3%
DISABILITY AGE UNDER 5
20.8/ 100
METRIC RATING
208th/ 347
METRIC RANK
1.1%
DISABILITY AGE UNDER 5
97.7/ 100
METRIC RATING
85th/ 347
METRIC RANK
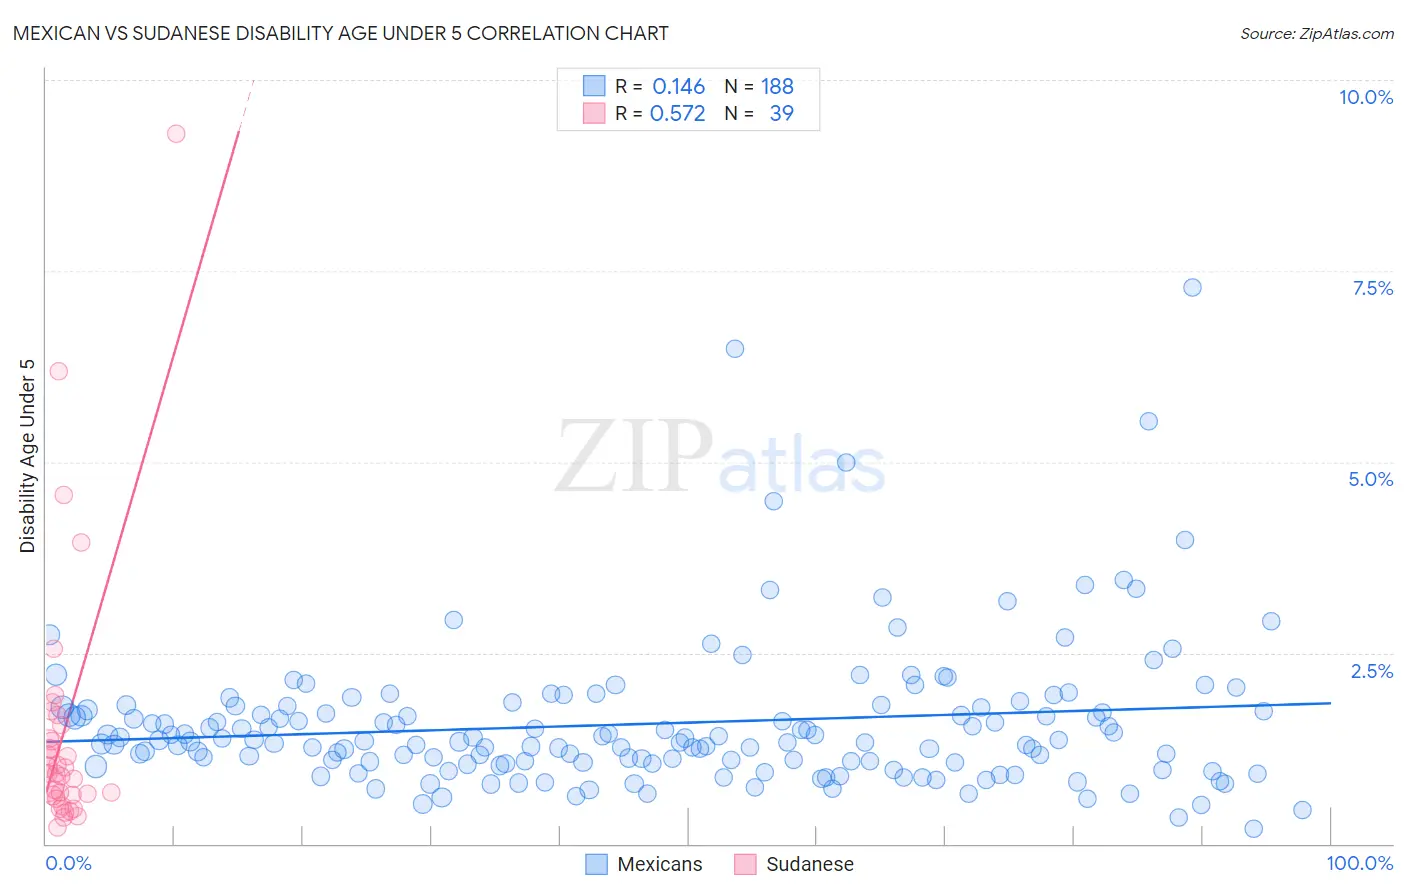
Mexican vs Sudanese Disability Age Under 5 Correlation Chart
The statistical analysis conducted on geographies consisting of 261,142,373 people shows a poor positive correlation between the proportion of Mexicans and percentage of population with a disability under the age of 5 in the United States with a correlation coefficient (R) of 0.146 and weighted average of 1.3%. Similarly, the statistical analysis conducted on geographies consisting of 86,195,620 people shows a substantial positive correlation between the proportion of Sudanese and percentage of population with a disability under the age of 5 in the United States with a correlation coefficient (R) of 0.572 and weighted average of 1.1%, a difference of 12.6%.
Disability Age Under 5 Correlation Summary
| Measurement | Mexican | Sudanese |
| Minimum | 0.20% | 0.21% |
| Maximum | 7.3% | 9.3% |
| Range | 7.1% | 9.1% |
| Mean | 1.6% | 1.5% |
| Median | 1.3% | 0.92% |
| Interquartile 25% (IQ1) | 1.1% | 0.63% |
| Interquartile 75% (IQ3) | 1.8% | 1.6% |
| Interquartile Range (IQR) | 0.72% | 0.93% |
| Standard Deviation (Sample) | 0.95% | 1.8% |
| Standard Deviation (Population) | 0.95% | 1.7% |
Similar Demographics by Disability Age Under 5
Demographics Similar to Mexicans by Disability Age Under 5
In terms of disability age under 5, the demographic groups most similar to Mexicans are Nigerian (1.3%, a difference of 0.060%), Bulgarian (1.3%, a difference of 0.18%), Pakistani (1.3%, a difference of 0.19%), Immigrants from Poland (1.3%, a difference of 0.21%), and Romanian (1.3%, a difference of 0.23%).
| Demographics | Rating | Rank | Disability Age Under 5 |
| Immigrants | Italy | 25.4 /100 | #201 | Fair 1.3% |
| Arapaho | 24.1 /100 | #202 | Fair 1.3% |
| Liberians | 24.0 /100 | #203 | Fair 1.3% |
| Immigrants | Europe | 23.6 /100 | #204 | Fair 1.3% |
| Romanians | 22.5 /100 | #205 | Fair 1.3% |
| Immigrants | Poland | 22.4 /100 | #206 | Fair 1.3% |
| Nigerians | 21.2 /100 | #207 | Fair 1.3% |
| Mexicans | 20.8 /100 | #208 | Fair 1.3% |
| Bulgarians | 19.5 /100 | #209 | Poor 1.3% |
| Pakistanis | 19.4 /100 | #210 | Poor 1.3% |
| Immigrants | Greece | 19.1 /100 | #211 | Poor 1.3% |
| Chileans | 18.8 /100 | #212 | Poor 1.3% |
| Immigrants | Sudan | 18.7 /100 | #213 | Poor 1.3% |
| Immigrants | Chile | 17.2 /100 | #214 | Poor 1.3% |
| Syrians | 16.1 /100 | #215 | Poor 1.3% |
Demographics Similar to Sudanese by Disability Age Under 5
In terms of disability age under 5, the demographic groups most similar to Sudanese are Immigrants from Zaire (1.1%, a difference of 0.080%), Okinawan (1.1%, a difference of 0.13%), Ugandan (1.1%, a difference of 0.14%), Immigrants from Dominican Republic (1.1%, a difference of 0.17%), and Immigrants from Jordan (1.1%, a difference of 0.23%).
| Demographics | Rating | Rank | Disability Age Under 5 |
| West Indians | 98.0 /100 | #78 | Exceptional 1.1% |
| Hmong | 98.0 /100 | #79 | Exceptional 1.1% |
| Immigrants | Trinidad and Tobago | 98.0 /100 | #80 | Exceptional 1.1% |
| Turks | 98.0 /100 | #81 | Exceptional 1.1% |
| Immigrants | Jordan | 97.9 /100 | #82 | Exceptional 1.1% |
| Immigrants | Syria | 97.9 /100 | #83 | Exceptional 1.1% |
| Immigrants | Zaire | 97.8 /100 | #84 | Exceptional 1.1% |
| Sudanese | 97.7 /100 | #85 | Exceptional 1.1% |
| Okinawans | 97.6 /100 | #86 | Exceptional 1.1% |
| Ugandans | 97.5 /100 | #87 | Exceptional 1.1% |
| Immigrants | Dominican Republic | 97.5 /100 | #88 | Exceptional 1.1% |
| Ethiopians | 97.2 /100 | #89 | Exceptional 1.1% |
| Chinese | 97.2 /100 | #90 | Exceptional 1.1% |
| Albanians | 97.2 /100 | #91 | Exceptional 1.1% |
| Immigrants | Cuba | 97.0 /100 | #92 | Exceptional 1.1% |