Immigrants from Eastern Asia vs Ottawa Female Disability
COMPARE
Immigrants from Eastern Asia
Ottawa
Female Disability
Female Disability Comparison
Immigrants from Eastern Asia
Ottawa
10.7%
FEMALE DISABILITY
100.0/ 100
METRIC RATING
13th/ 347
METRIC RANK
14.2%
FEMALE DISABILITY
0.0/ 100
METRIC RATING
327th/ 347
METRIC RANK
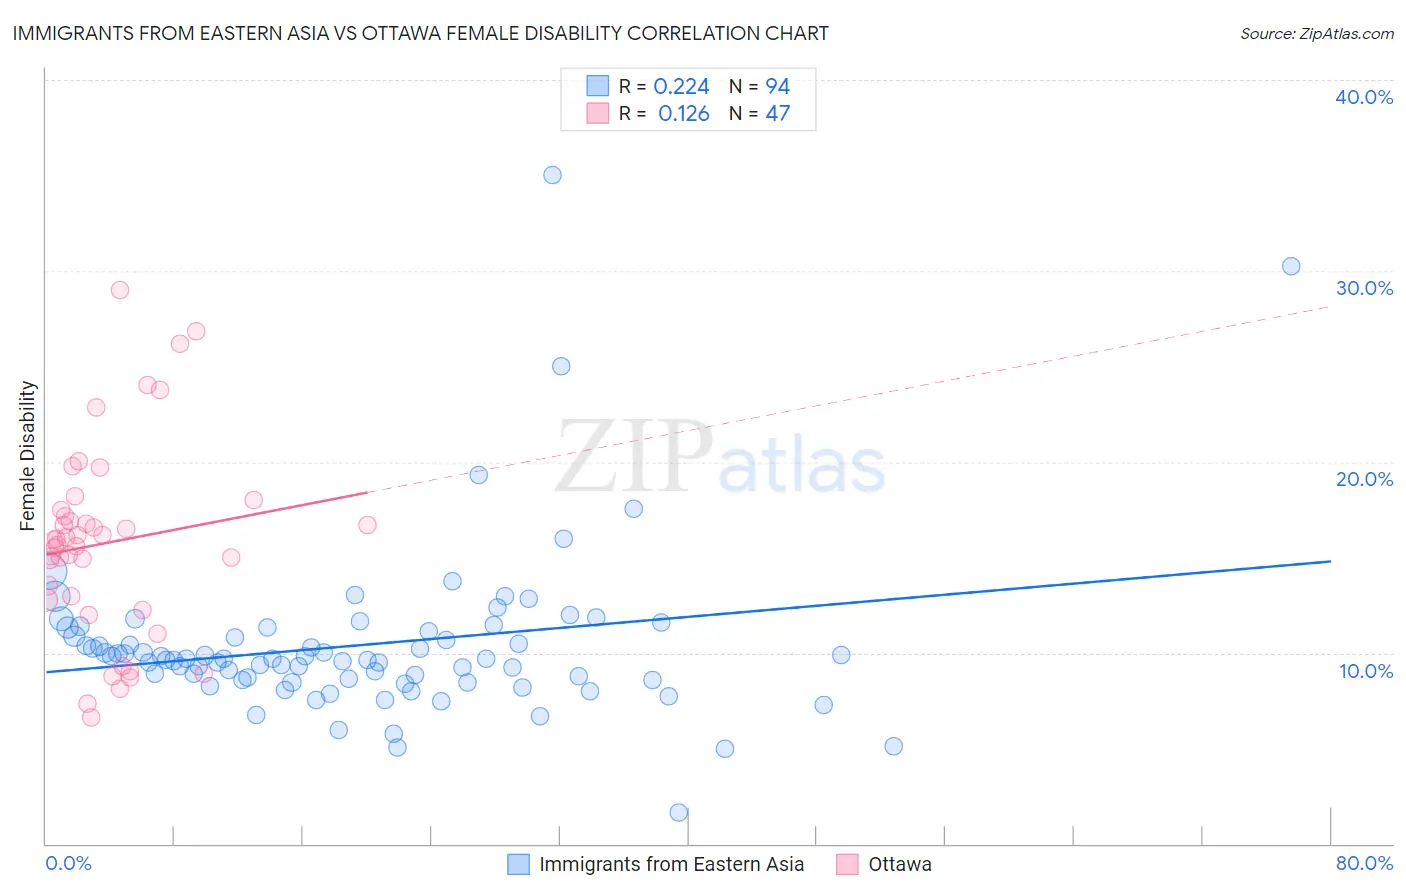
Immigrants from Eastern Asia vs Ottawa Female Disability Correlation Chart
The statistical analysis conducted on geographies consisting of 499,845,203 people shows a weak positive correlation between the proportion of Immigrants from Eastern Asia and percentage of females with a disability in the United States with a correlation coefficient (R) of 0.224 and weighted average of 10.7%. Similarly, the statistical analysis conducted on geographies consisting of 49,954,639 people shows a poor positive correlation between the proportion of Ottawa and percentage of females with a disability in the United States with a correlation coefficient (R) of 0.126 and weighted average of 14.2%, a difference of 33.2%.
Female Disability Correlation Summary
| Measurement | Immigrants from Eastern Asia | Ottawa |
| Minimum | 1.6% | 6.6% |
| Maximum | 35.0% | 29.0% |
| Range | 33.4% | 22.4% |
| Mean | 10.4% | 15.8% |
| Median | 9.7% | 15.9% |
| Interquartile 25% (IQ1) | 8.6% | 12.8% |
| Interquartile 75% (IQ3) | 11.2% | 17.5% |
| Interquartile Range (IQR) | 2.6% | 4.7% |
| Standard Deviation (Sample) | 4.4% | 5.1% |
| Standard Deviation (Population) | 4.4% | 5.0% |
Similar Demographics by Female Disability
Demographics Similar to Immigrants from Eastern Asia by Female Disability
In terms of female disability, the demographic groups most similar to Immigrants from Eastern Asia are Immigrants from China (10.7%, a difference of 0.040%), Immigrants from Israel (10.7%, a difference of 0.070%), Immigrants from Korea (10.6%, a difference of 0.49%), Burmese (10.7%, a difference of 0.54%), and Okinawan (10.8%, a difference of 0.61%).
| Demographics | Rating | Rank | Female Disability |
| Bolivians | 100.0 /100 | #6 | Exceptional 10.4% |
| Immigrants | Singapore | 100.0 /100 | #7 | Exceptional 10.4% |
| Immigrants | South Central Asia | 100.0 /100 | #8 | Exceptional 10.5% |
| Iranians | 100.0 /100 | #9 | Exceptional 10.6% |
| Immigrants | Hong Kong | 100.0 /100 | #10 | Exceptional 10.6% |
| Immigrants | Korea | 100.0 /100 | #11 | Exceptional 10.6% |
| Immigrants | Israel | 100.0 /100 | #12 | Exceptional 10.7% |
| Immigrants | Eastern Asia | 100.0 /100 | #13 | Exceptional 10.7% |
| Immigrants | China | 100.0 /100 | #14 | Exceptional 10.7% |
| Burmese | 100.0 /100 | #15 | Exceptional 10.7% |
| Okinawans | 100.0 /100 | #16 | Exceptional 10.8% |
| Indians (Asian) | 100.0 /100 | #17 | Exceptional 10.8% |
| Immigrants | Iran | 100.0 /100 | #18 | Exceptional 10.8% |
| Immigrants | Venezuela | 100.0 /100 | #19 | Exceptional 10.9% |
| Immigrants | Pakistan | 100.0 /100 | #20 | Exceptional 10.9% |
Demographics Similar to Ottawa by Female Disability
In terms of female disability, the demographic groups most similar to Ottawa are Cape Verdean (14.2%, a difference of 0.0%), Osage (14.3%, a difference of 0.43%), Comanche (14.2%, a difference of 0.44%), Navajo (14.2%, a difference of 0.55%), and Native/Alaskan (14.1%, a difference of 0.69%).
| Demographics | Rating | Rank | Female Disability |
| Americans | 0.0 /100 | #320 | Tragic 14.1% |
| Potawatomi | 0.0 /100 | #321 | Tragic 14.1% |
| Pueblo | 0.0 /100 | #322 | Tragic 14.1% |
| Blacks/African Americans | 0.0 /100 | #323 | Tragic 14.1% |
| Natives/Alaskans | 0.0 /100 | #324 | Tragic 14.1% |
| Navajo | 0.0 /100 | #325 | Tragic 14.2% |
| Comanche | 0.0 /100 | #326 | Tragic 14.2% |
| Ottawa | 0.0 /100 | #327 | Tragic 14.2% |
| Cape Verdeans | 0.0 /100 | #328 | Tragic 14.2% |
| Osage | 0.0 /100 | #329 | Tragic 14.3% |
| Yuman | 0.0 /100 | #330 | Tragic 14.5% |
| Immigrants | Cabo Verde | 0.0 /100 | #331 | Tragic 14.6% |
| Pima | 0.0 /100 | #332 | Tragic 14.8% |
| Immigrants | Azores | 0.0 /100 | #333 | Tragic 14.9% |
| Cherokee | 0.0 /100 | #334 | Tragic 14.9% |